Gold Price Forecast: XAU/USD struggles below $1,800 despite golden cross, softer USD
- Gold pares weekly gains, eases from intraday high of late.
- Mixed headlines concerning China, firmer US Treasury yields confuse traders.
- US PMIs, risk catalysts in focus for fresh impulse.
- Extreme ratios point to gold and silver price readjustments
Gold (XAU/USD) eases from weekly top to $1,783, up 0.07% intraday as European traders brace for Thursday’s bell.
The yellow metal initially cheered the US dollar weakness to print a three-day high, also benefited from the bullish chart pattern. However, recently mixed catalysts probe the gold buyers afterward.
Firmer equities and hopes of US stimulus backed the US dollar weakness the previous day. Following that, an absence of fresh catalysts, despite Fed tapering chatters from Federal Reserve Governor Randal Quarles and Cleveland Fed President Loretta Mester, failed to recall USD bulls.
However, the recently mixed headlines concerning China’s Evergrande and risk emanating from Beijing’s stressed property market seem to probe the gold buyers of late.
That said, the US Dollar Index (DXY) benefits from the consolidation in the market sentiment, despite printing a seven-day downtrend to a fresh three-week low near 93.50, around 93.60 by the press time. It’s worth noting that the US 10-year Treasury yields retreat after refreshing a five-month high, recently up 1.8 basis points (bps) to 1.65%.
Moving on, risk catalysts and the second-tier US data concerning jobs and activities may entertain gold traders ahead of Friday’s preliminary readings of October PMIs. Overall, gold prices remain in the bearish consolidation mode unless the Fed tapering chatters wane, which becomes less likely considering the firmer US data and reflation fears.
Technical analysis
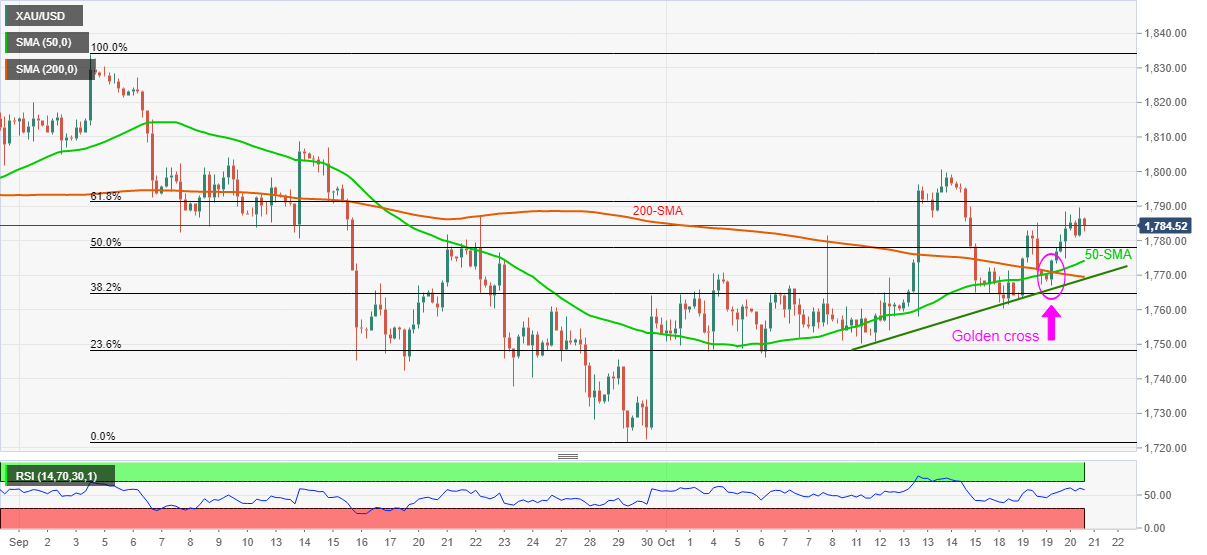
Multiple hurdles since early September probes gold buyers even as the golden cross, an upside break of 50-SMA to 200-SMA, favors the metal buyers.
Hence, a clear run-up beyond the $1,791 hurdle, also including 61.8% Fibonacci retracement (Fibo.) of September’s fall, becomes necessary for the gold bulls to justify the stated golden cross pattern.
Following that, the monthly peak near the $1,800 threshold adds to the upside filters before flagging the run-up towards the $1,834 key hurdle, tested twice since July.
On the flip side, the weekly rising trend line and 200-SMA, near $1,770 by the press time, restricts short-term declines of the gold prices.
In a case where gold sellers manage to conquer the $1,770 support convergence, multiple levels around $1,745 and $1,730 may entertain them ahead of the last monthly low near $1,721.
Gold: Daily chart
Trend: Further recovery eyed