Back
28 Jun 2021
US Dollar Index Price Analysis: Downside contained by the 200-day SMA
↵
- DXY looks to regain upside traction near 92.00.
- The 200-day SMA near 91.50 emerges as a key support.
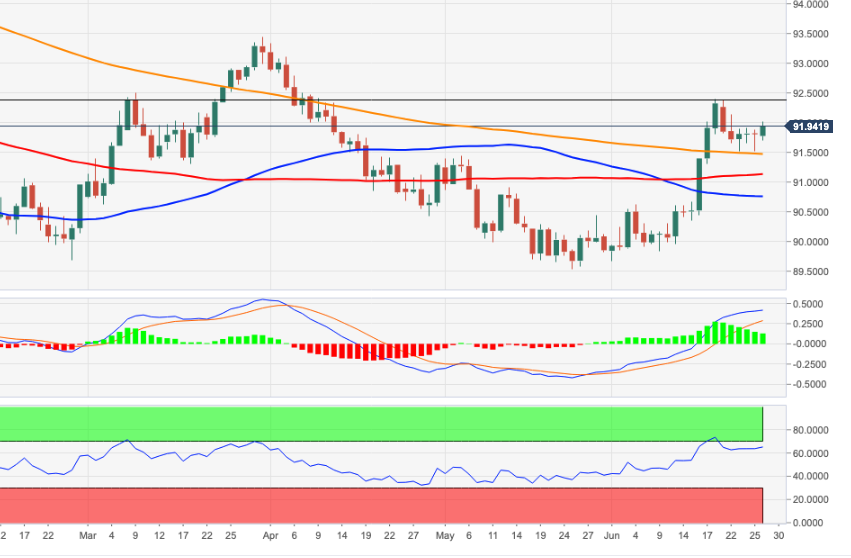
DXY attempts to break above the recent consolidative theme and flirts with the key barrier at the 92.00 yardstick.
If the buying impulse gathers extra steam, then the next hurdle of note is located at last week’s monthly tops near 92.50. This area of resistance is also reinforced by the Fibo level at 92.46.
In the meantime, and looking at the broader scenario, a sustainable breakout of the 200-day SMA (91.47) should shift the outlook for the buck to positive.
DXY daily chart