GBP/USD Price Analysis: Fades recovery moves from 21-day EMA
- GBP/USD marks another failure to cross 1.3200 despite keeping bounce off 1.3115.
- A two-month-old support line adds to the downside filters.
- Bulls will have a bumpy road ahead unless crossing the late-December 2019 top.
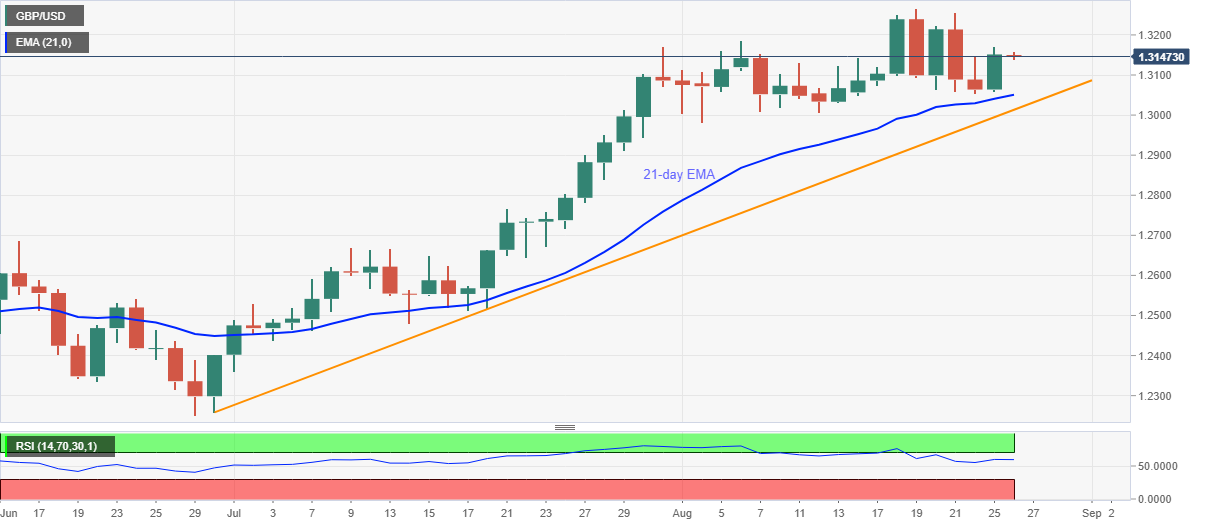
GBP/USD struggles to keep the previous day’s upside momentum while easing to 1.3145 during early Wednesday. The Cable bounced off 21-day EMA on Tuesday but couldn’t cross 1.3200 mark comprising March month top.
Even so, an ascending trend line from June 30, at 1.3013, follows the 21-day EMA level of 1.3050 to question the quote’s short-term downside amid strong RSI conditions.
Also acting as additional support will be the 1.3000 round-figures and the monthly low around 1.2980.
On the contrary, an upside break of 1.3200 will challenge the monthly high, also the yearly top, near 1.3270 and December 31, 2020 peak surrounding 1.3285.
Given the bulls’ ability to cross the 1.3285 level on a daily basis, also trade beyond the 1.3300 threshold, the GBP/USD prices can head towards the year 2019 high of 1.3515.
GBP/USD daily chart

Trend: Pullback expected
