Back
30 Mar 2020
Gold Price Analysis: XAU/USD bounces from 2020 lows, hovering near $1600/oz
- XAU/USD rose considerably last week as the Fed announced a limitless bond-buying scheme.
- The level to beat for bulls is the 1636 level.
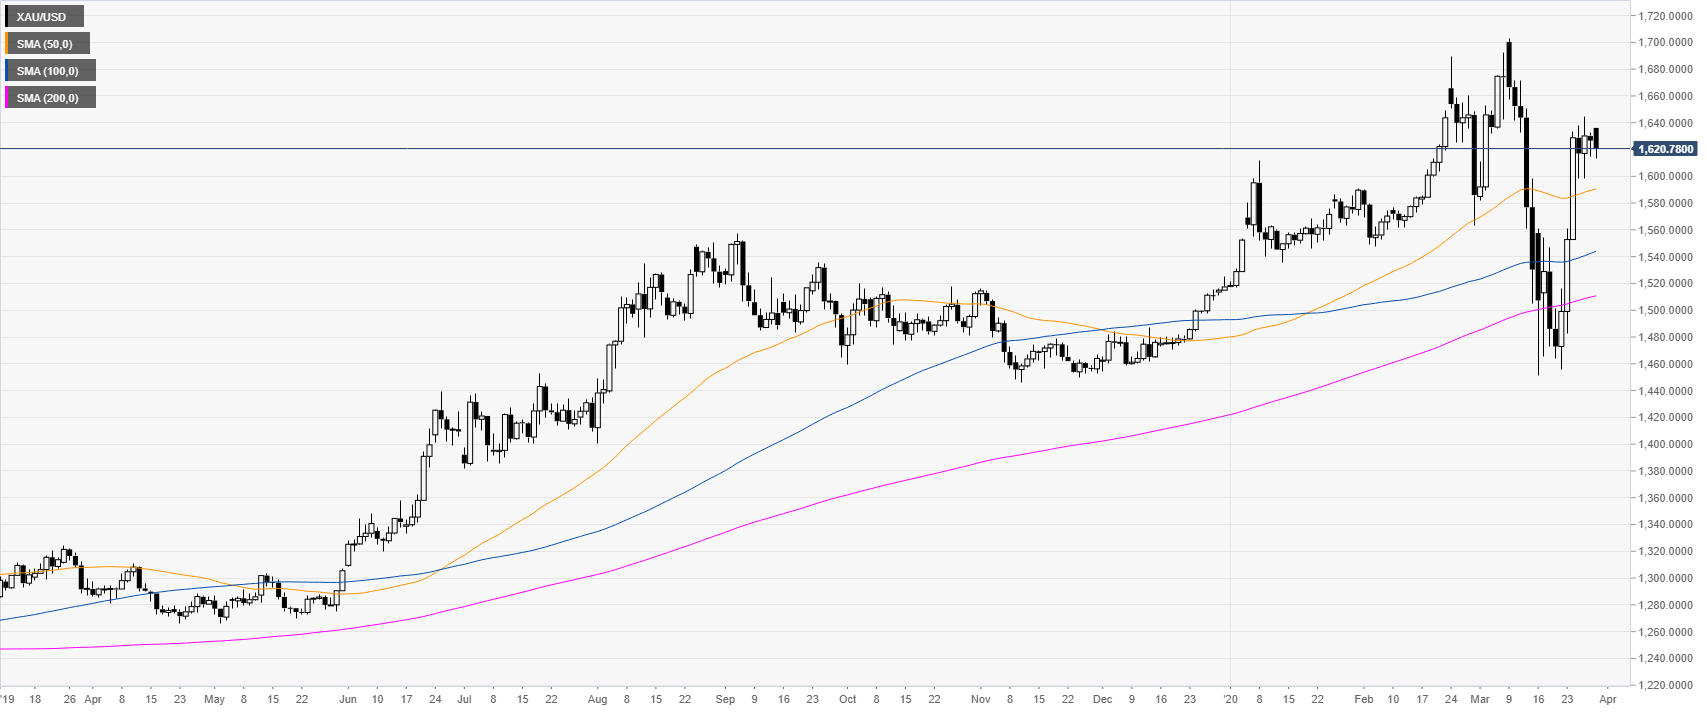
XAU/USD daily chart
The yellow metal is consolidating the recent bullish breakout while remaining confined in the 1600/1640 price range as traders are looking for a direction.
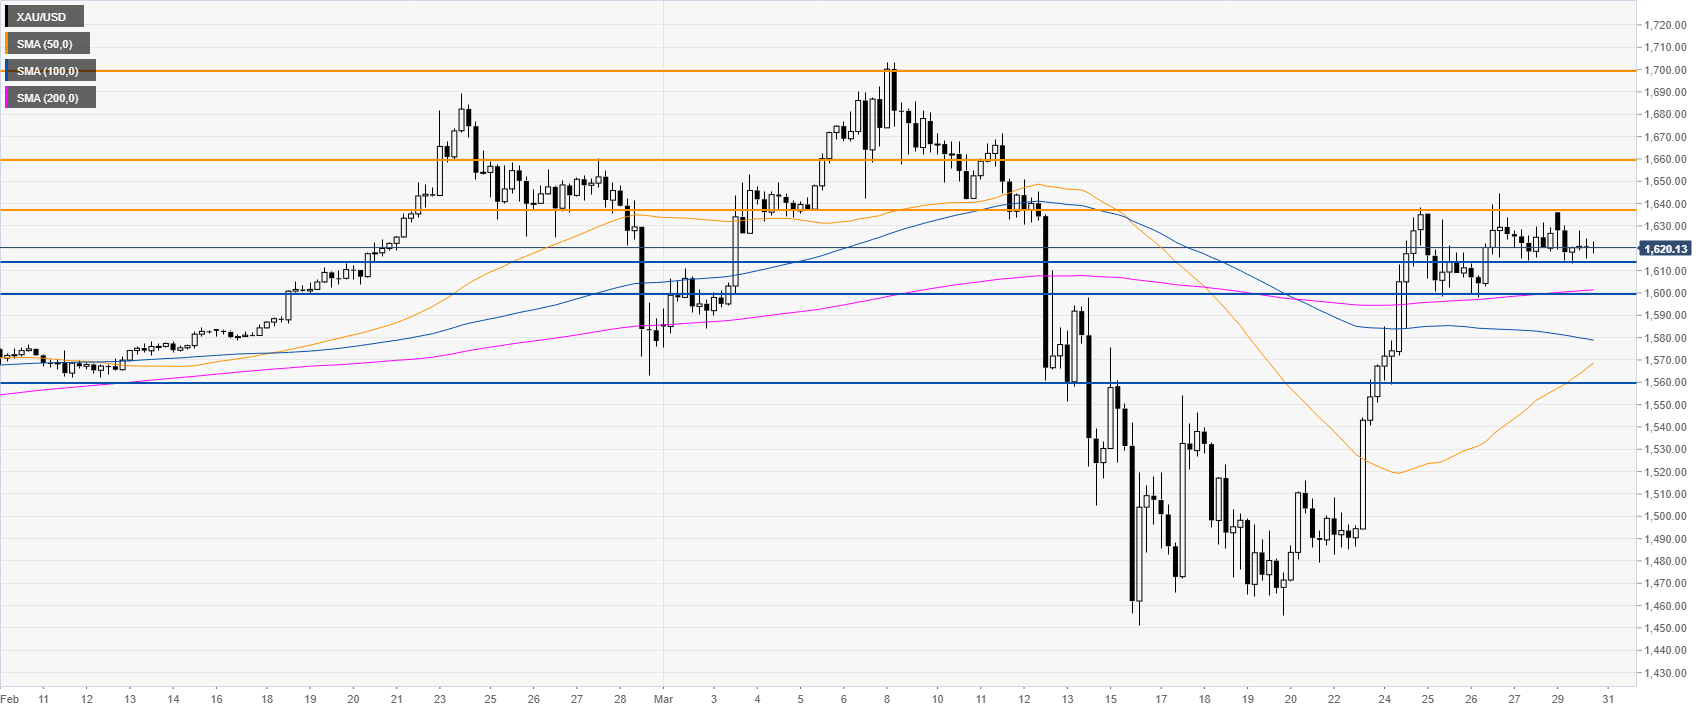
XAU/USD four-hour chart
The bullion is trading in a very tight range above the 1614 support level and the main SMAs on the four-hour chart suggesting an upward bias in the medium term. Bulls remain in control as they can be setting up for break of the 1636 resistance en route to the 1660 level and 1700 figure if XAU/USD gathers enough steam. Support can emerge near 1614, 1600 and 1560 levels.
Resistance: 1636, 1660, 1700
Support: 1614, 1600, 1560
Additional key levels