Gold Price Analysis: Lower high, overbought RSI check buyers inside short-term rising channel
- Gold buyers catch a breath after rising heavily to the fresh 11-year top during the last two days.
- MACD and RSI both favor a pullback while the latest lower highs on the hourly chart support the argument.
- An upward sloping trend channel from Tuesday keeps pleasing the bulls.
Gold prices stay mildly positive around $1,621 during early Friday. The yellow metal has been flashing a lower high formation since its pullback from $1,623.80 while MACD is also likely turning negative. Further to support the odds of a pullback are RSI conditions that signal a halt to the additional upside.
As a result, the bullion may decline to Wednesday’s high of $1,613 while the support line of a short-term rising channel, at $1,611 can question extra downside.
If at all the quote dips below $1,611, $1,605 and $1,600 can entertain the bears ahead of recalling the early-week levels surrounding $1,584/83.
Meanwhile, an upside break of $1,623 can trigger fresh run-up towards the channel resistance of $1,627.
During the precious metal’s additional rise past-$1,627, the rising trendline connecting highs marked during September 20119 and January 2020, close to $1630/31, will be in the spotlight.
Read: Gold Price Analysis: Path of least resistance is up, $1,626 next target – Confluence Detector
Gold hourly chart
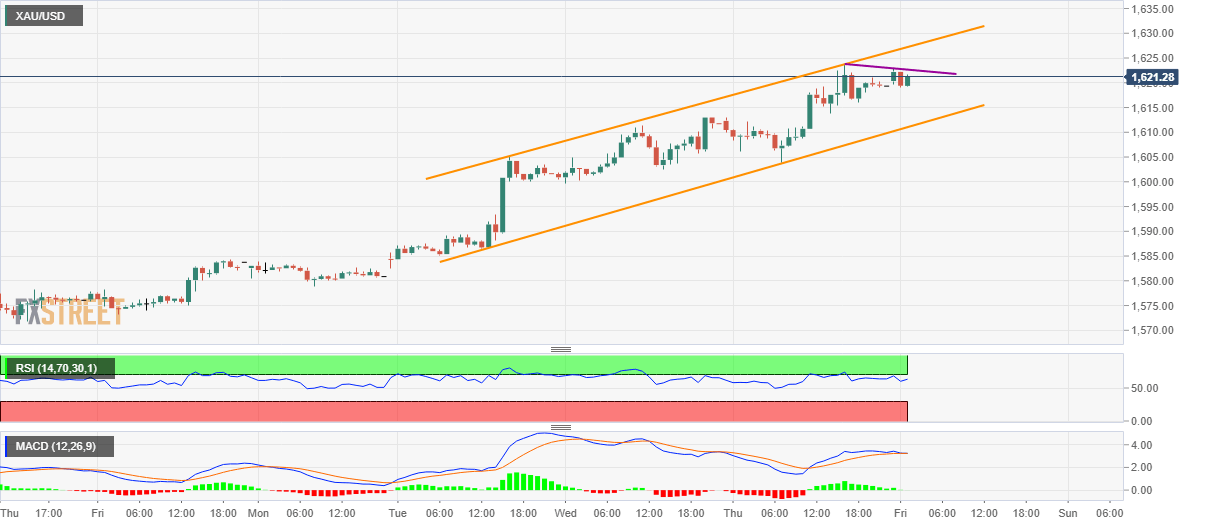
Trend: Pullback expected