Back
7 Feb 2020
Gold Price Analysis: XAU/USD bulls attacking the 1570 resistance one more time
- Gold formed a base above $1550/oz level and the 200-SMA on the four-hour chart.
- The 1570/75 area is an important resistance zone for bulls to break.
- The level to beat for bears is the 1560 support.
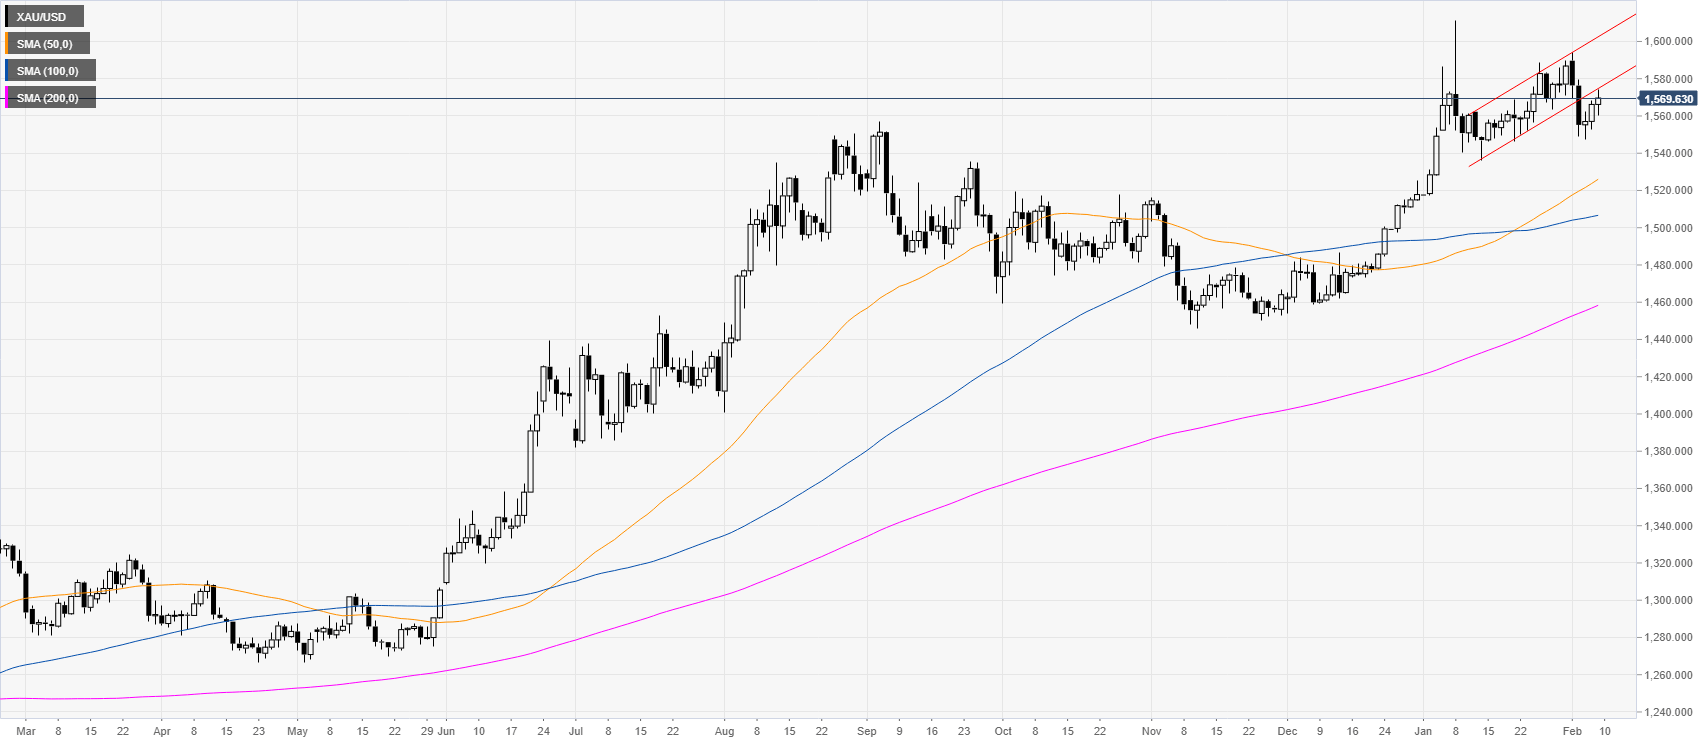
Gold daily chart
XAU/USD is trading in an uptrend above its main daily simple moving averages (SMAs). However, gold broke below a bear flag and has then been recovering slightly in the last three sessions.
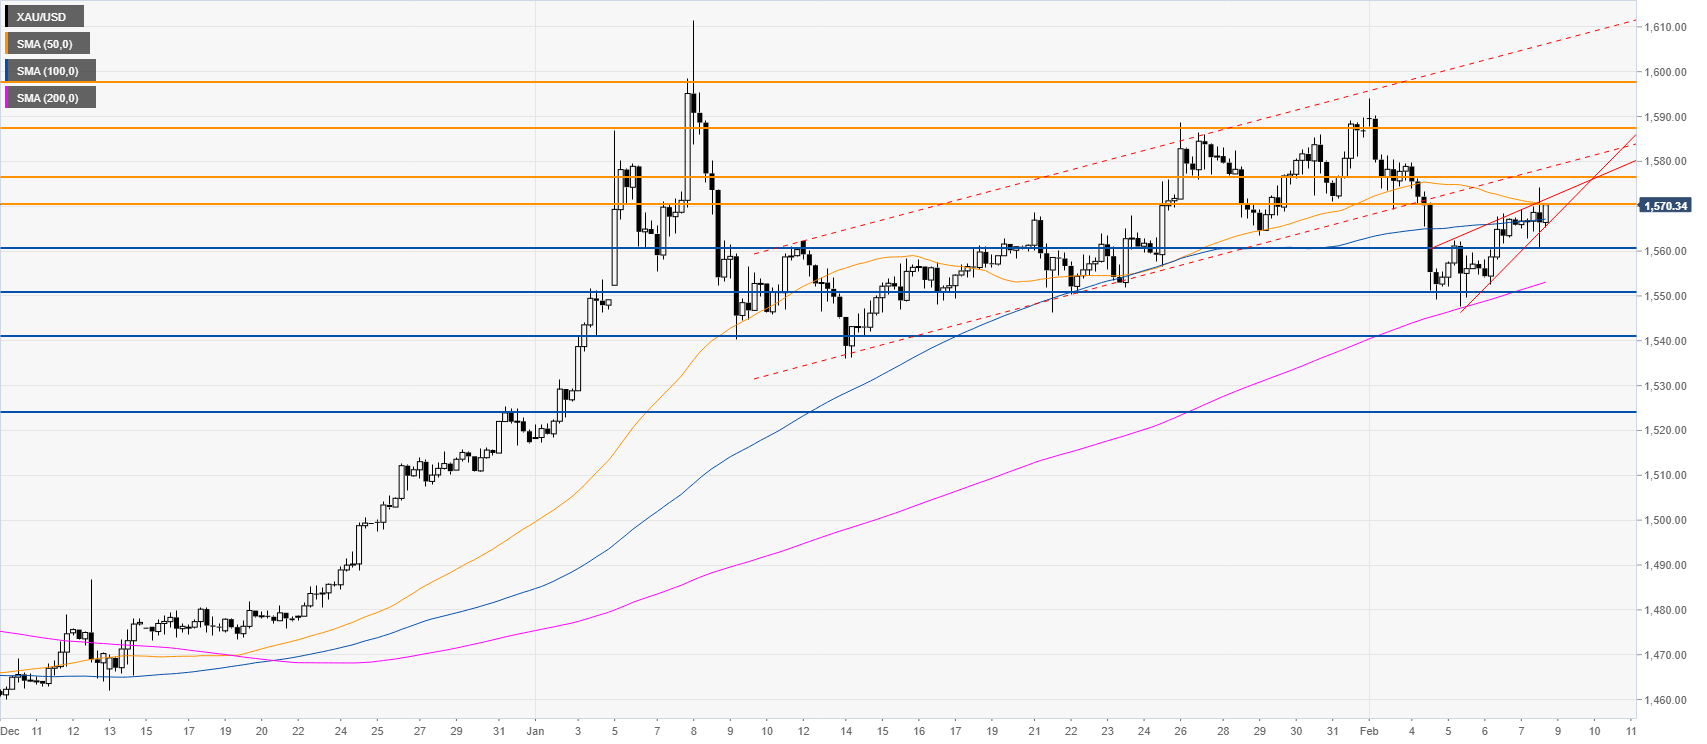
Gold four-hour chart
After the breakdown of the January bear flag, the bears are considering the current upmove a correction that will lead to another potential bear leg. However, a clear break above the 1570/75 resistance should invalidate the bearish bias and re-establish a bullish momentum in the market. Bears are looking for a break of the 1560 support with follow-through below 1550 and a potential drop to the 1540 level.
Additional key levels