USD/CHF Technical Analysis: Sluggish below 100-DMA, 38.2% Fibonacci
- USD/CHF declines for the second consecutive day.
- 50% Fibonacci retracement, October low could challenge sellers.
- An upside break of 0.9890 highlights 200-DMA, 23.6% Fibonacci retracement.
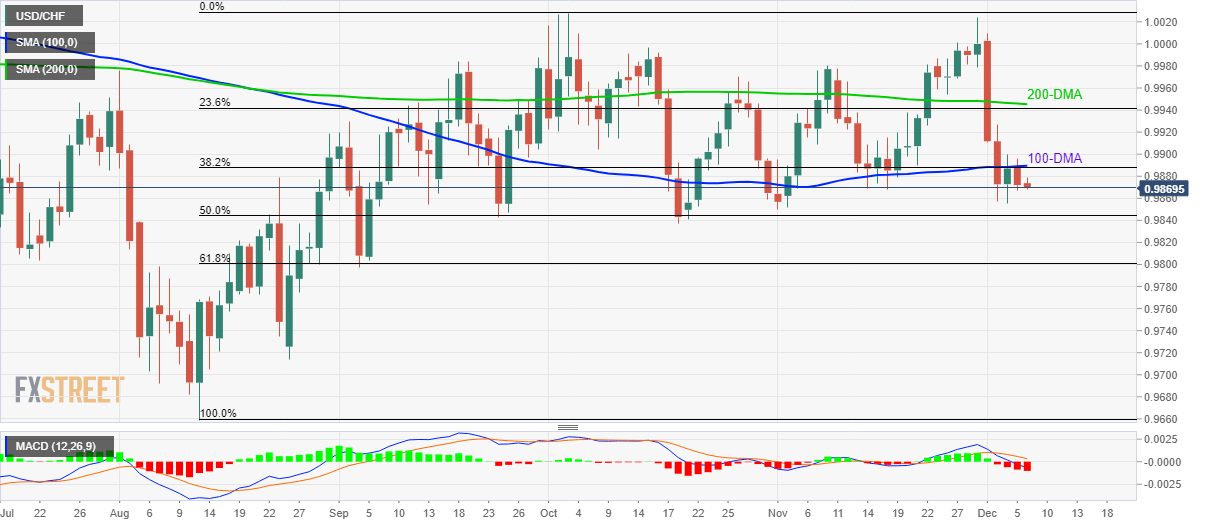
USD/CHF extends the recent pullback while flashing 0.9870 as a quote during early Friday. The pair recently pulled back from 100-Day Simple Moving Average (DMA) and 38.2% Fibonacci retracement of August-October rise.
Prices are now likely declining towards 50% Fibonacci retracement and October low, near 0.9845 and 0.9835 respectively.
In a case sellers refuse to respect 0.9835 rest-point, September bottom and 61.8% Fibonacci retracement near 0.9800 will return to the charts.
Alternatively, pair’s sustained trading beyond 0.9890 resistance confluence can push bulls to confront 200-DMA and 23.6% Fibonacci retracement level around 0.9940/45.
While bearish conditions of 12-bar Moving Average Convergence and Divergence (MACD) indicate the pair’s weakness, nearness to the key support limes the downside, which in turn portrays a sluggish move. However, sustained trading below key resistance makes the pair vulnerable.
USD/CHF daily chart
Trend: Sideways