Back
8 Oct 2019
GBP/USD technical analysis: Cable tumbles towards 1.2200 handle on Brexit uncertainties
- GBP/USD takes a dive below the 1.2300 handle.
- The level to beat for sellers is the 1.2200 figure.
- Brexit: Three scenarios and GBP/USD price targets as B-Day approaches.
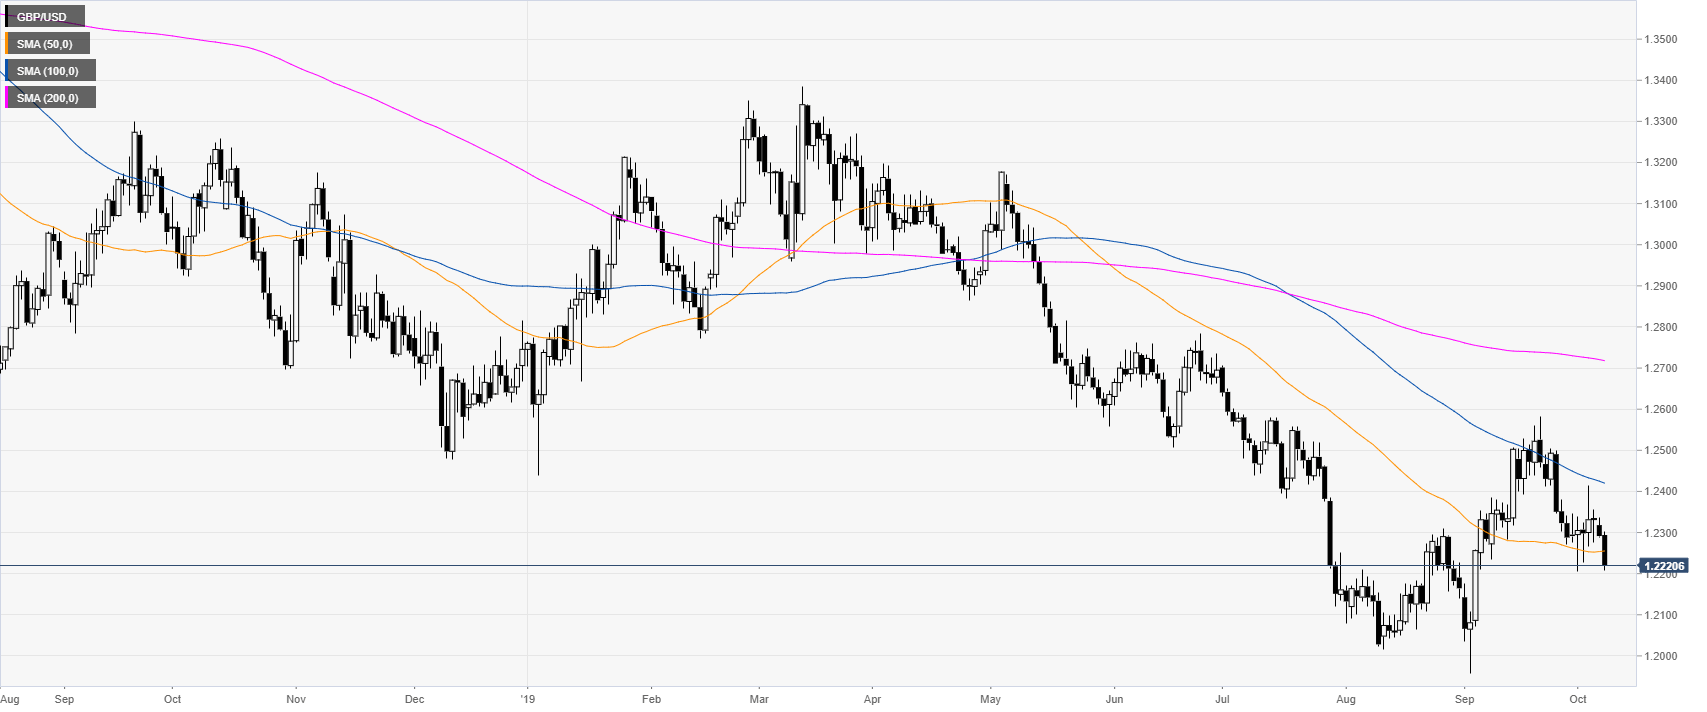
GBP/USD daily chart
On the daily chart, the Sterling is trading in a bear trend below its main daily simple moving averages (DSMAs). The Pound is on the back foot as pessimism over Brexit is taking over.
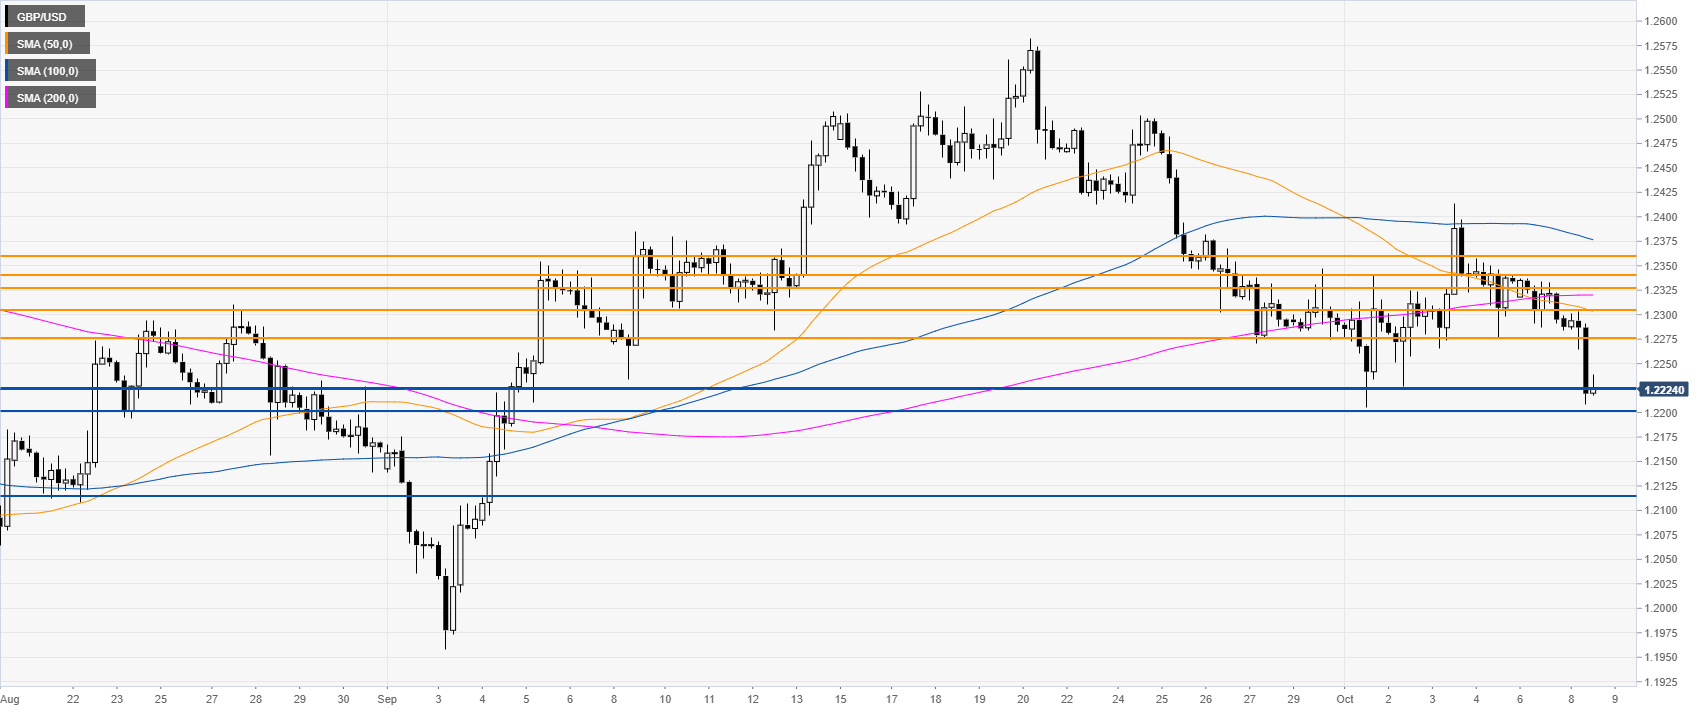
GBP/USD four-hour chart
GBP/USD is trading below the main SMAs on the four-hour chart, suggesting a bearish bias in the medium term. The spot is challenging the 1.2224/20 support zone. A break below it could lead to further losses towards 1.2114 price level, according to the Technical Confluences Indicator.
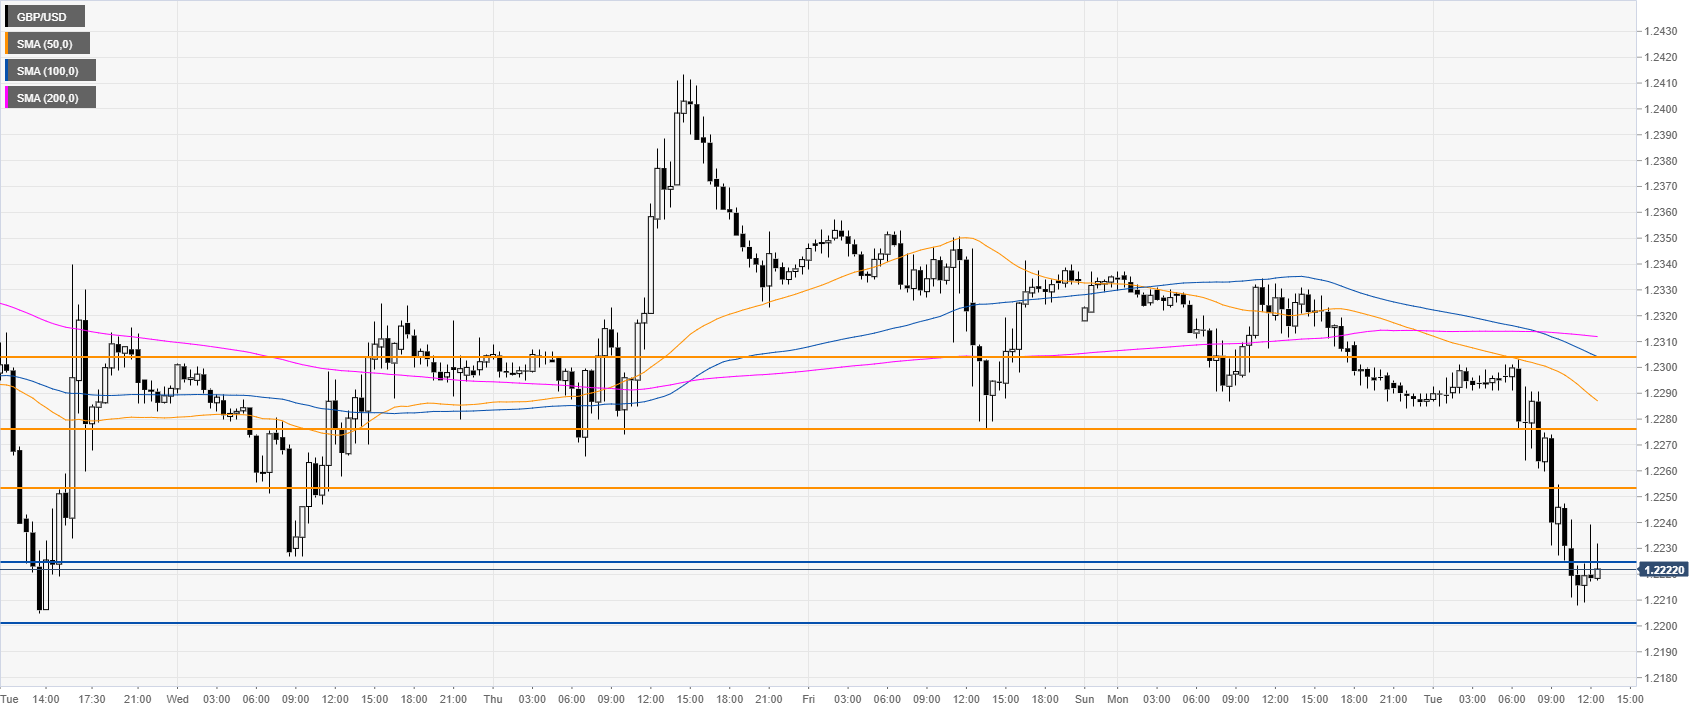
GBP/USD 30-minute
The Sterling is trading below its main SMAs, suggesting a bearish bias in the short term. Immediate resistances are seen at 1.2253, 1.2276 and 1.2305 price levels, according to the Technical Confluences Indicator.
Additional key levels