Back


5 Aug 2019
GBP/USD technical analysis: Cable sidelined near multi-month lows and challenging 1.2167 resistance
- GBP/USD is stabilizing near the monthly lows above the 1.2100 figure.
- The levels to beat for buyers are seen at 1.2167 and 1.2190 on the way up.
GBP/USD daily chart
GBP/USD is stabilizing near multi-month lows attempting to create a correction above the 1.2100 figure while below its main daily simple moving averages (DSMAs).
GBP/USD 4-hour chart
GBP/USD is trading below its main SMAs, suggesting bearish momentum in the near term. However, bears will need to reclaim the 1.2135 and 1.2100 support to continue the downtrend towards 1.2065, according to the Technical Confluences Indicator.
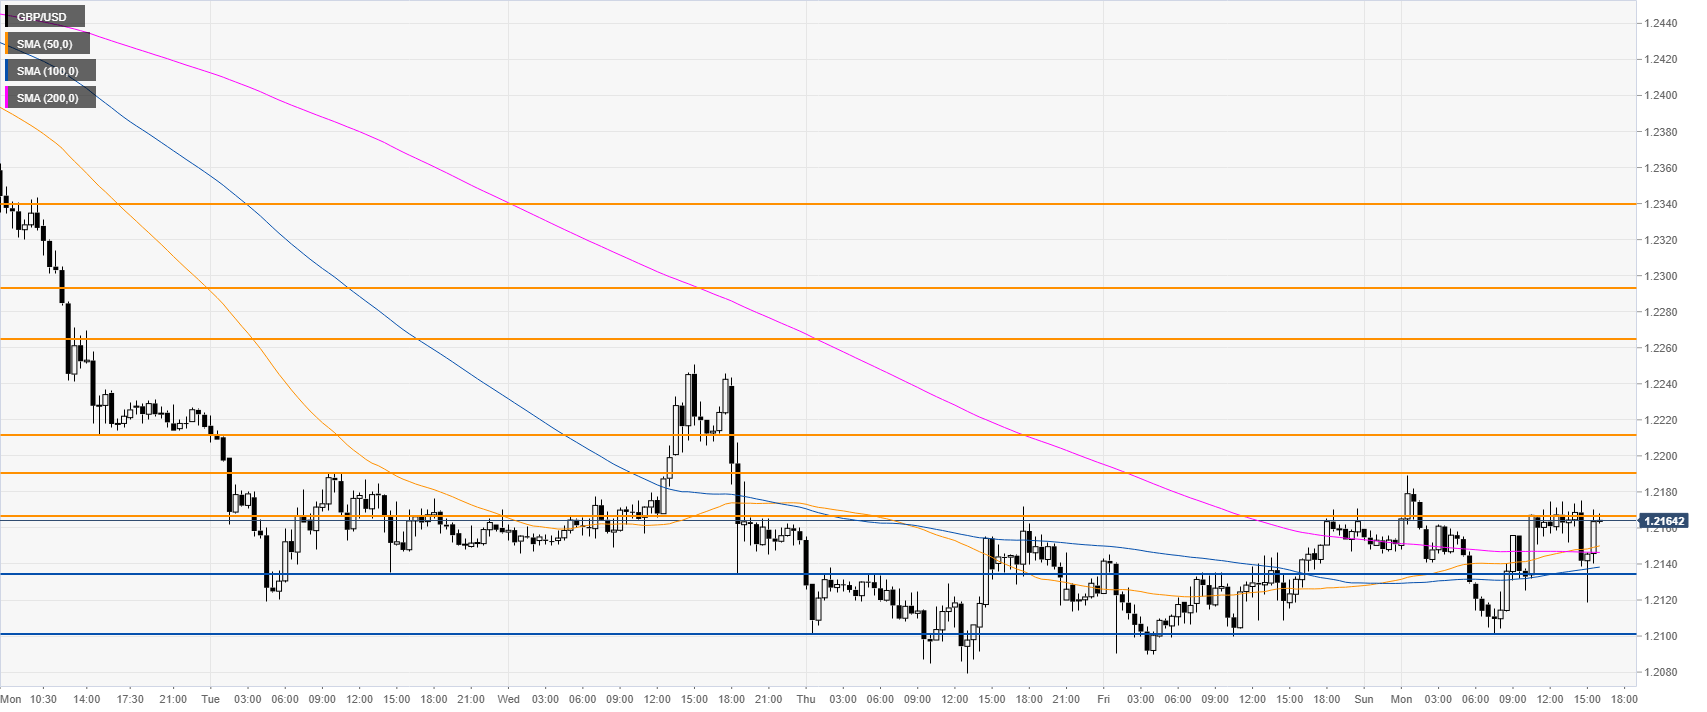
GBP/USD 30-minute chart
Cable is challenging the daily highs and the 1.2167 resistance while trading above its main SMAs. The buyers want to break this critical resistance to potentially extend the correction towards 1.2190, 1.2211 and 1.2265, according to the Technical Confluences Indicator.
Additional key levels