GBP/USD Technical Analysis: Cable bulls discard FOMC as market holds tight above 1.3050 level
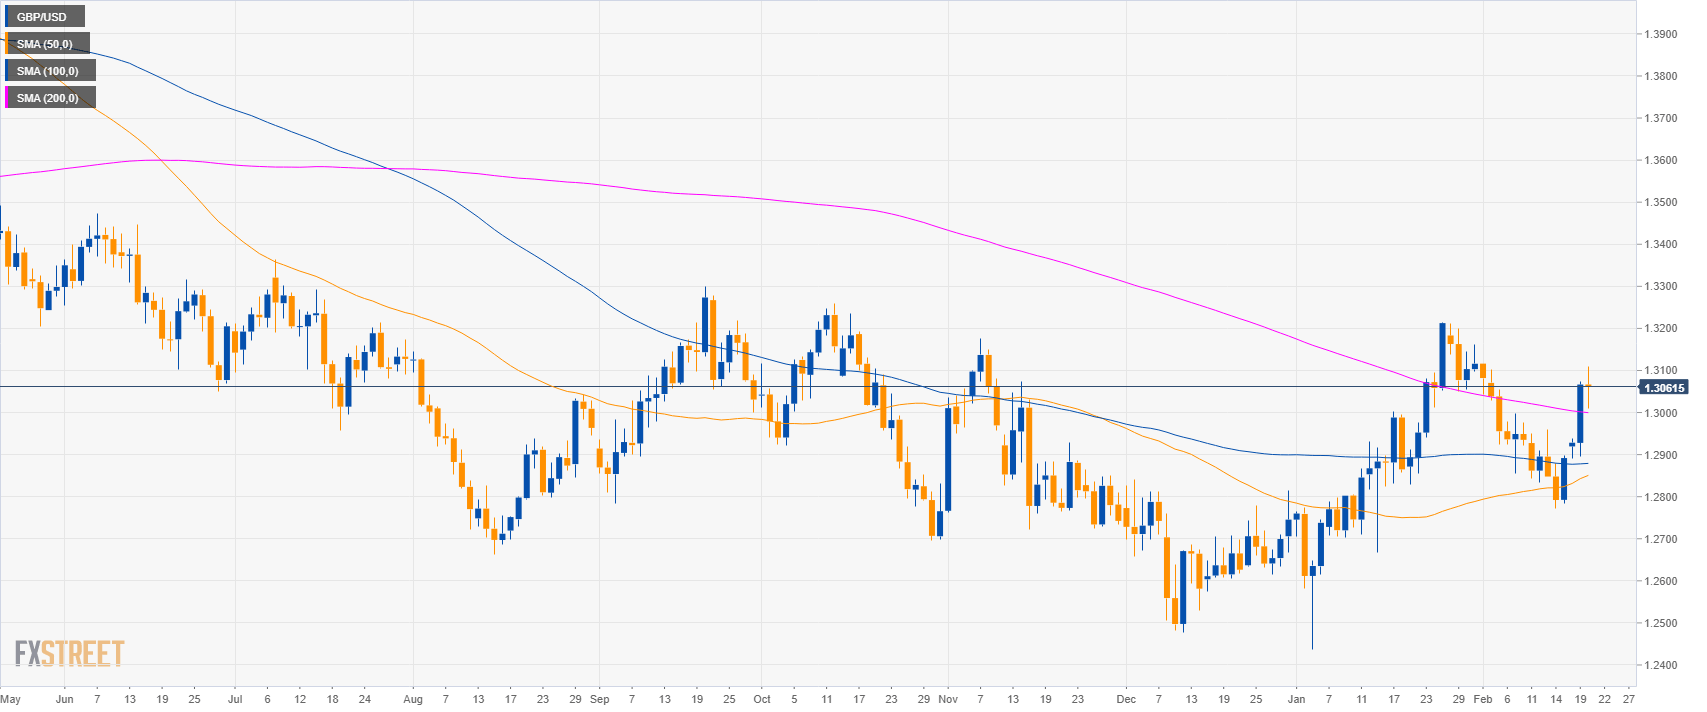
GBP/USD daily chart
- GBP/USD bulls are trying to reclaim the 200-day simple moving average (SMA).
- The FOMC Minutes came in slightly more hawkish than anticipated giving USD a temporary knee-jerk reaction up.
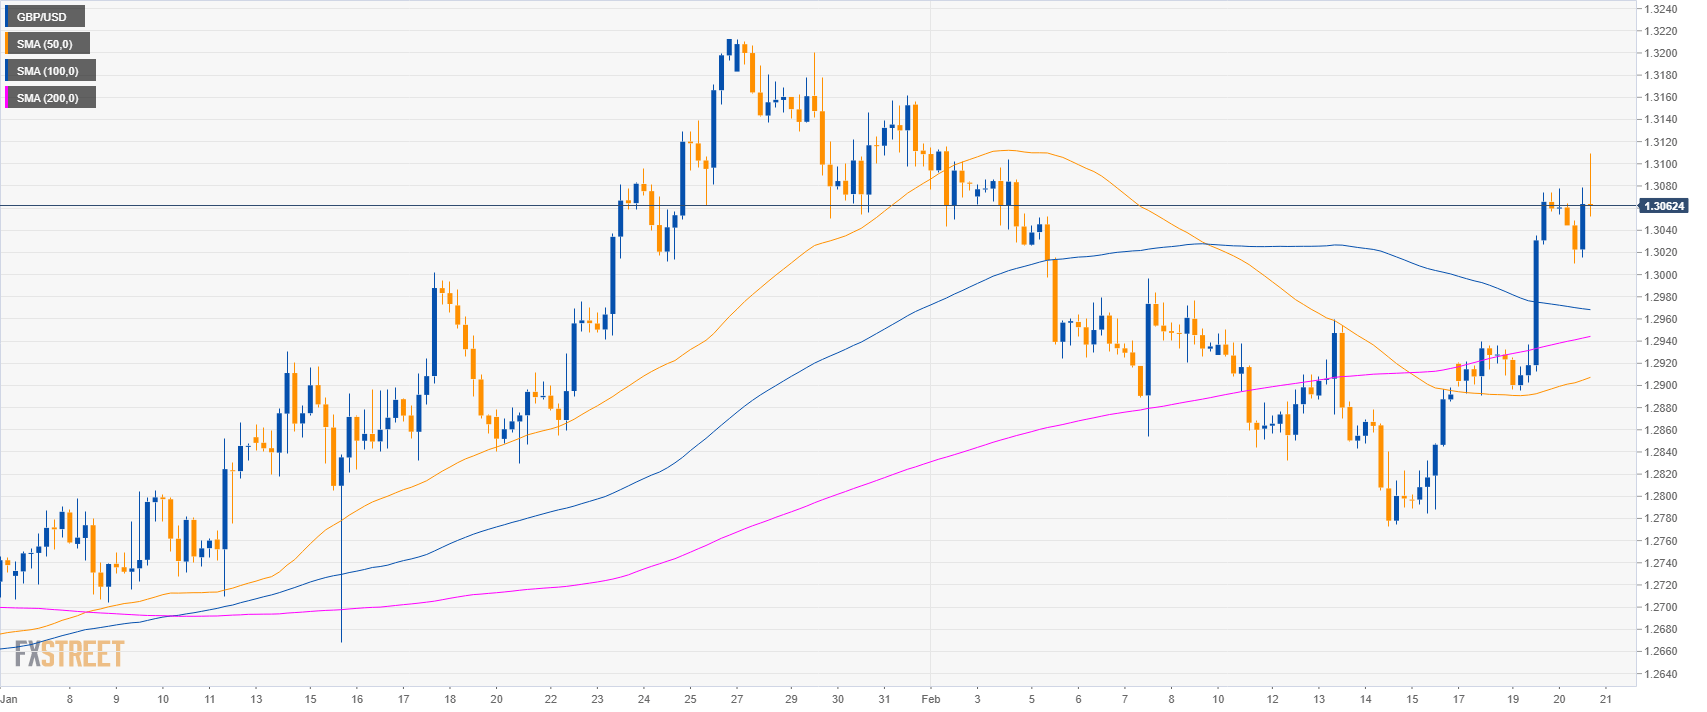
GBP/USD 4-hour chart
- GBP/USD is trading above the main SMAs suggesting a bullish bias in the medium-term.
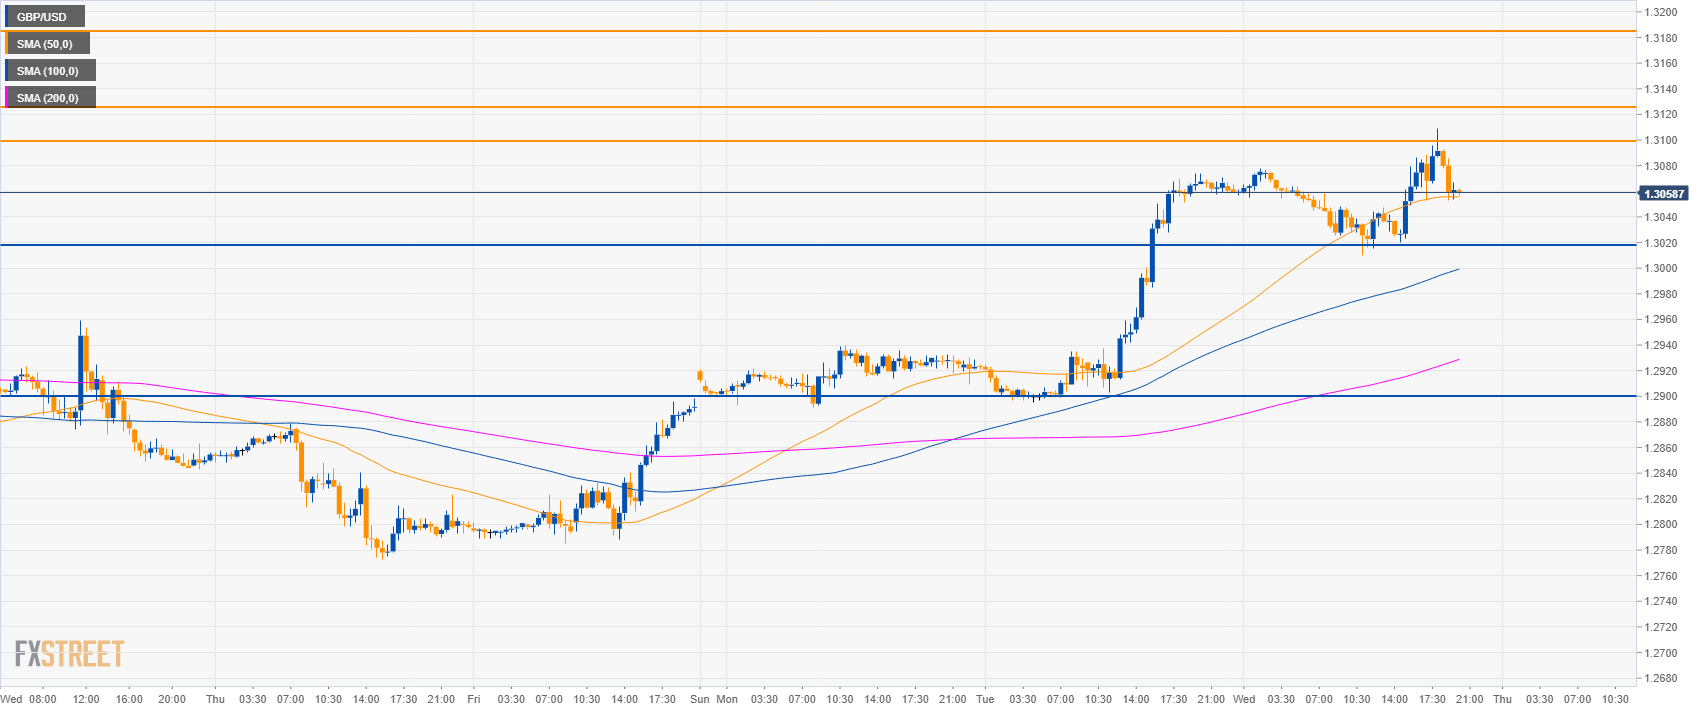
GBP/USD 30-minute chart
- GBP/USD is trading above the main SMAs suggesting bullish momentum in the short-term.
- The level to beat for bulls is 1.3100. On the way up, the next target is at 1.3125 and 1.3185 level.
- Support is at 1.3020 and 1.2900 level.
Additional key levels
GBP/USD
Overview:
Today Last Price: 1.3061
Today Daily change: -6 pips
Today Daily change %: -0.05%
Today Daily Open: 1.3067
Trends:
Daily SMA20: 1.2999
Daily SMA50: 1.2843
Daily SMA100: 1.2878
Daily SMA200: 1.3002
Levels:
Previous Daily High: 1.3074
Previous Daily Low: 1.2895
Previous Weekly High: 1.2959
Previous Weekly Low: 1.2773
Previous Monthly High: 1.3214
Previous Monthly Low: 1.2438
Daily Fibonacci 38.2%: 1.3006
Daily Fibonacci 61.8%: 1.2963
Daily Pivot Point S1: 1.295
Daily Pivot Point S2: 1.2833
Daily Pivot Point S3: 1.2771
Daily Pivot Point R1: 1.3129
Daily Pivot Point R2: 1.3191
Daily Pivot Point R3: 1.3308