Back
18 Feb 2019
USD/JPY Technical Analysis: BPC formation on 4H chart can recall 111.45
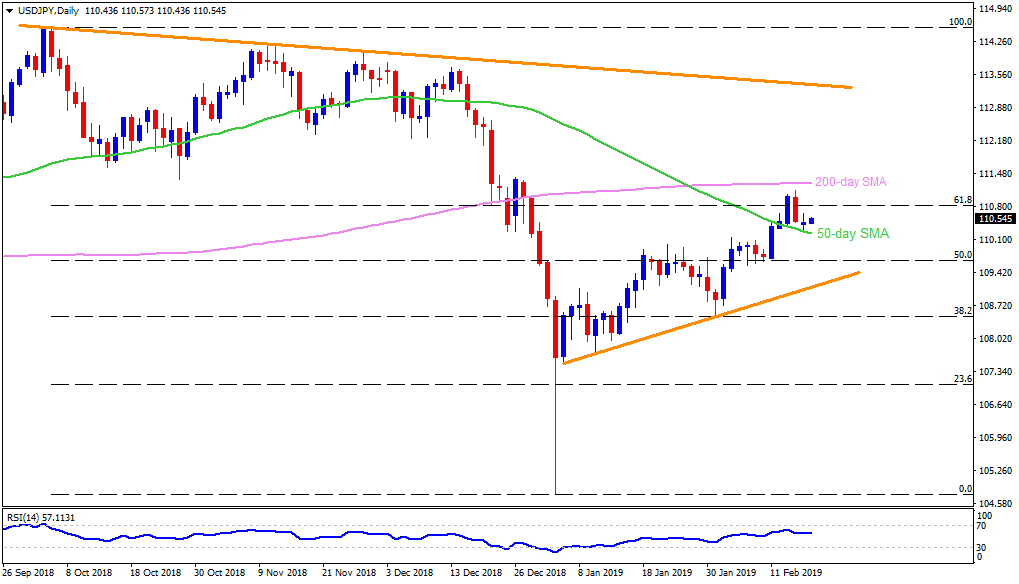
USD/JPY daily chart
- USD/JPY remain near to 110.50 during early Monday.
- The pair took a U-turn from 111.12 on Thursday but refrained to slid under 50-day simple moving average (SMA) of 110.23 on Friday.
- Sustained trading beyond 50-day SMA signals brighter chances of its up-moves to 200-day SMA level of 111.30 once it clears 111.12 resistance.
- Given the pair’s ability to trade successfully beyond 111.30, late-December high around 111.45 and 111.80 may entertain buyers.
- On a downside closing beneath 110.23, 110.00 and 109.80 can come back on the chart.
- Additionally, 50% Fibonacci retracement of its October – January slump, at 109.65, followed by six weeks long upward sloping trend-line, at 109.00, may limit the pair’s downturn past-109.65.
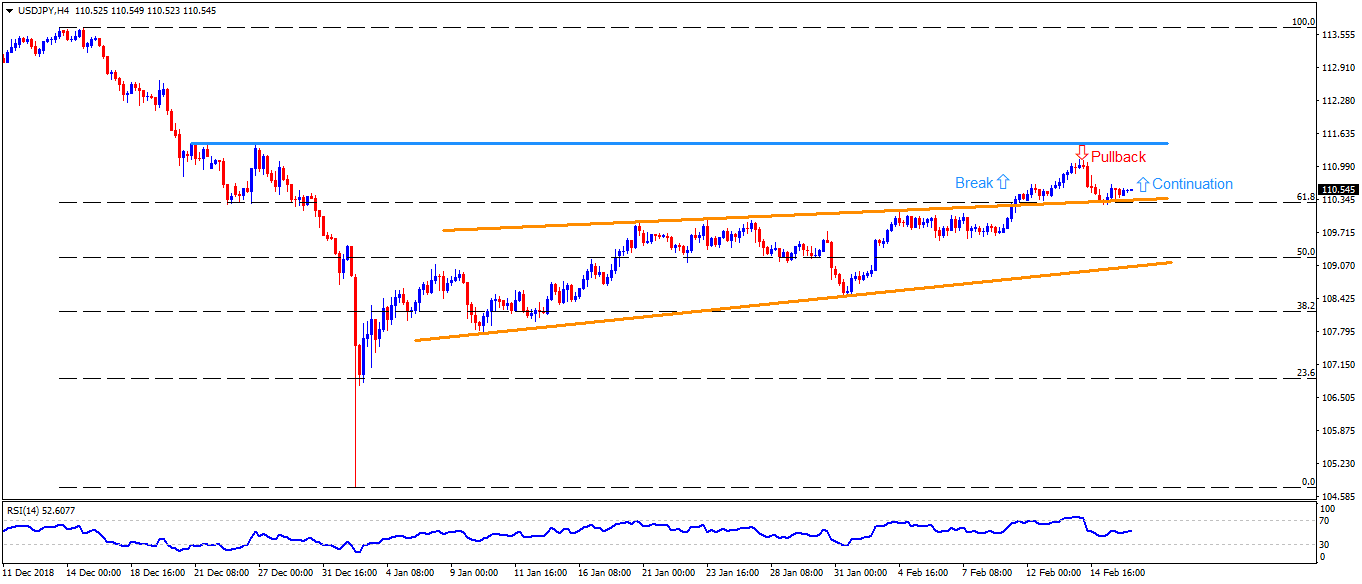
USD/JPY 4-Hour chart
- Considering the pair’s bounce off the trend-line connecting late-January highs to the early-month tops, short-term breakout-pullback-continuation (BPC) formation seems underway on the 4Hr chart.
- The pattern supports extended recovery to a last-week high of 111.15 prior to confronting 111.45 horizontal-resistance, a break of which can escalate the upward trajectory to 112.15.
- Alternatively, pair’s dip under 110.28, near to 61.8% Fibonacci retracement of mid-December to January declines, denies the upside signaling pattern and may recall 110.00 as a quote.
- During the pair’s declines below 110.00, 109.80 and 109.60 can entertain the sellers.
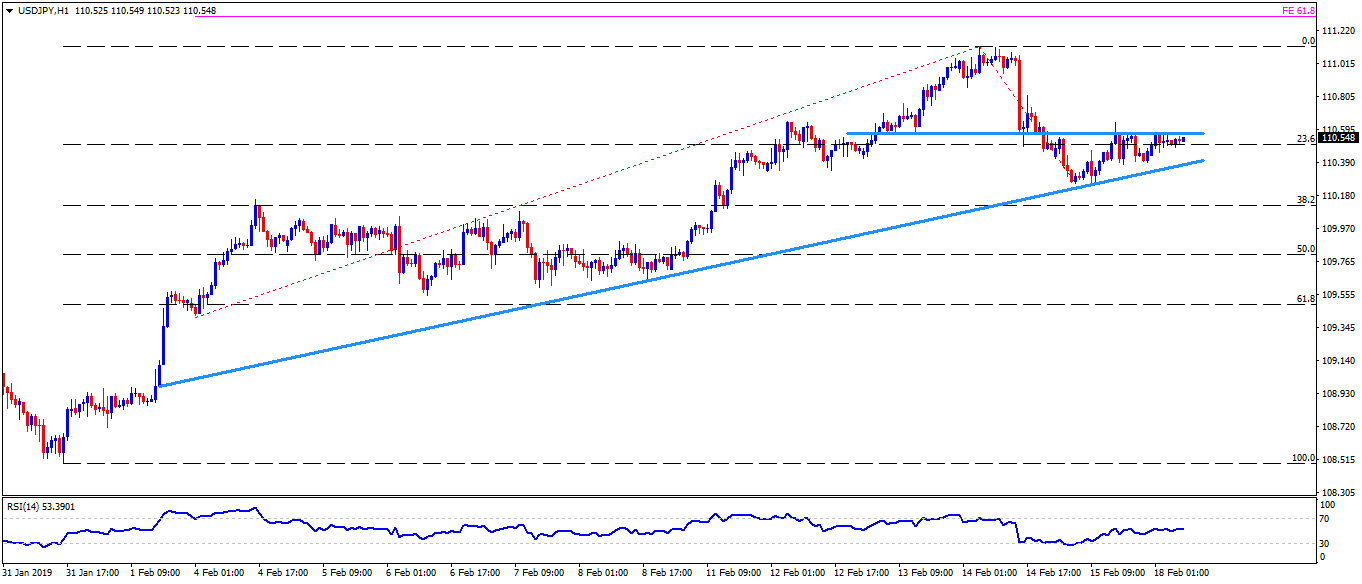
USD/JPY hourly chart
- A horizontal-line around 110.60 continues to act as immediate upside barrier for the pair’s rise toward 110.90 whereas 111.00, 111.15 and 61.8% Fibonacci expansion of its recent trade pattern, at 111.30, could play their role of resistance afterward.
- Meanwhile, an ascending trend-line connecting month’s lows since February 01, at 110.35, can limit the pair’s adjacent declines, a break of which might not hesitate to recall 110.25 and 110.10 on the chart.