EUR/GBP Technical Analysis: Euro sidelined against Pound below 0.8770 level
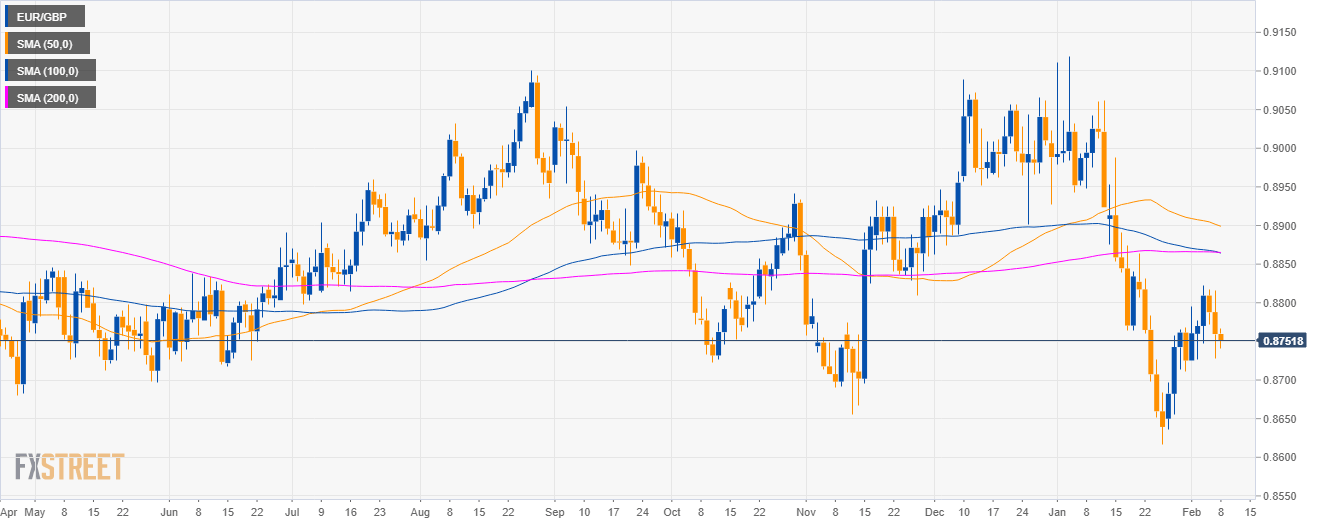
EUR/GBP daily chart
- EUR/GBP is trading in a sideways trend below the 200-day simple moving averages (SMAs).
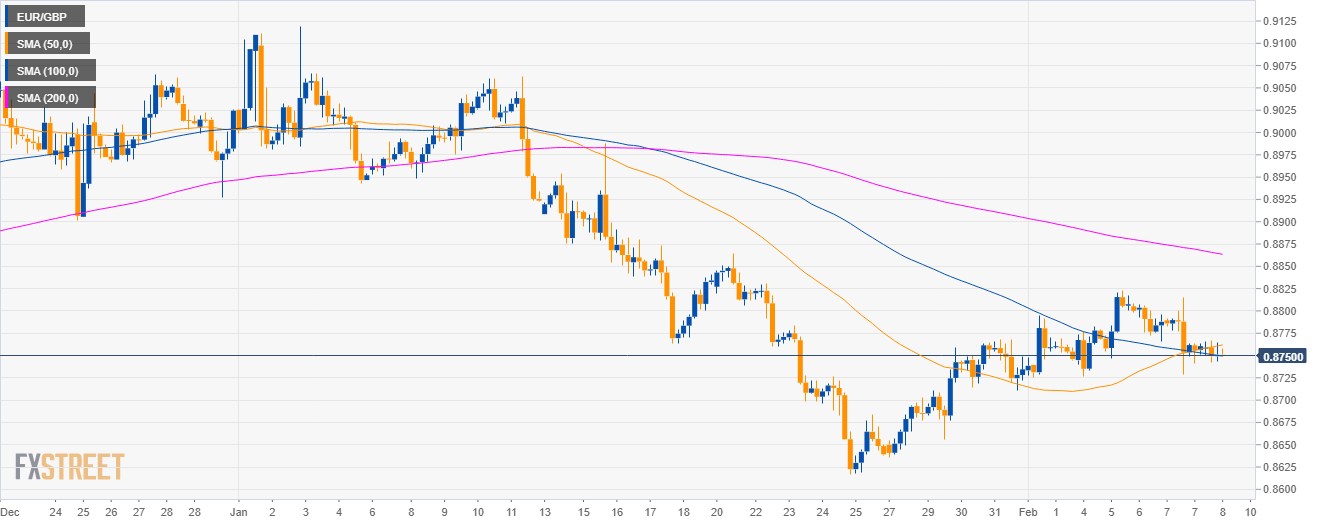
EUR/GBP 4-hour chart
- EUR/GBP is trading between the 500 and 100 SMAs on the 4-hour chart suggesting a sideways market in the medium term.
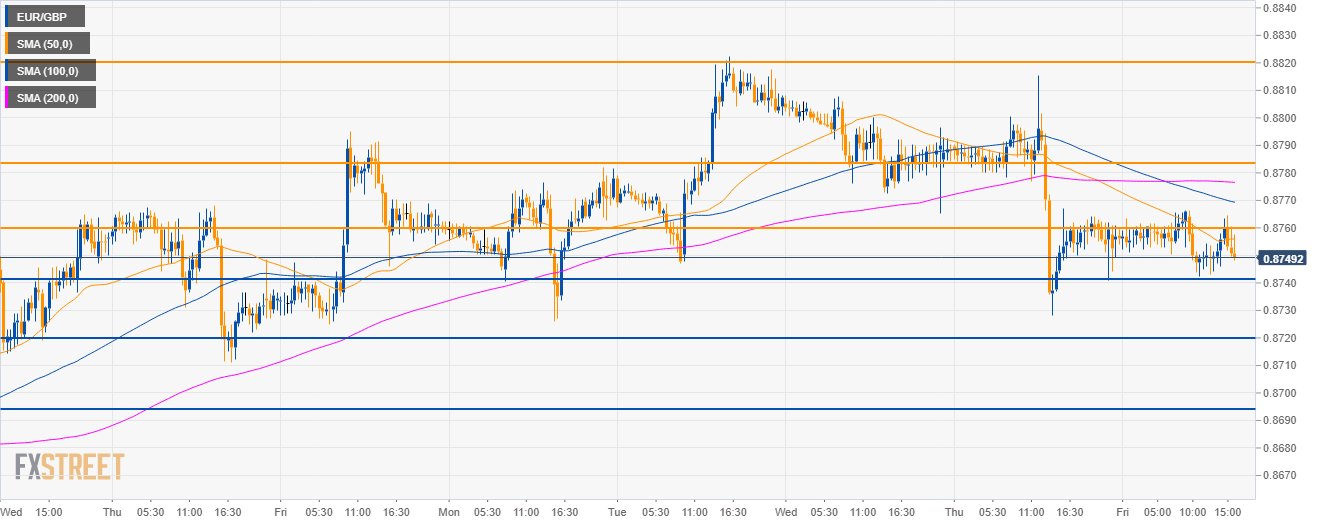
EUR/GBP 30-minute chart
- EUR/GBP has broken below 0.8785 support and its main SMAs suggesting bearish momentum in the short-term.
- If bears break below 0.8740, the next supports to the downside can now be seen near 0.8720, 0.8695 and all the way down to 0.8660 if bears gather enough steam.
Additional key levels
EUR/GBP
Overview:
Today Last Price: 0.875
Today Daily change: -10 pips
Today Daily change %: -0.11%
Today Daily Open: 0.876
Trends:
Daily SMA20: 0.8777
Daily SMA50: 0.8902
Daily SMA100: 0.8867
Daily SMA200: 0.8866
Levels:
Previous Daily High: 0.8816
Previous Daily Low: 0.8728
Previous Weekly High: 0.8795
Previous Weekly Low: 0.8636
Previous Monthly High: 0.9119
Previous Monthly Low: 0.8617
Daily Fibonacci 38.2%: 0.8762
Daily Fibonacci 61.8%: 0.8782
Daily Pivot Point S1: 0.872
Daily Pivot Point S2: 0.868
Daily Pivot Point S3: 0.8633
Daily Pivot Point R1: 0.8807
Daily Pivot Point R2: 0.8855
Daily Pivot Point R3: 0.8895