USD/JPY Price Analysis: Closes in on resistance with possibility of temporary pullback
- USD/JPY closes in on a resistance level at former highs.
- The pair could pullback temporarily from the technical resistance level.
- The uptrend remains intact, however, suggesting further upside will probably eventually follow.
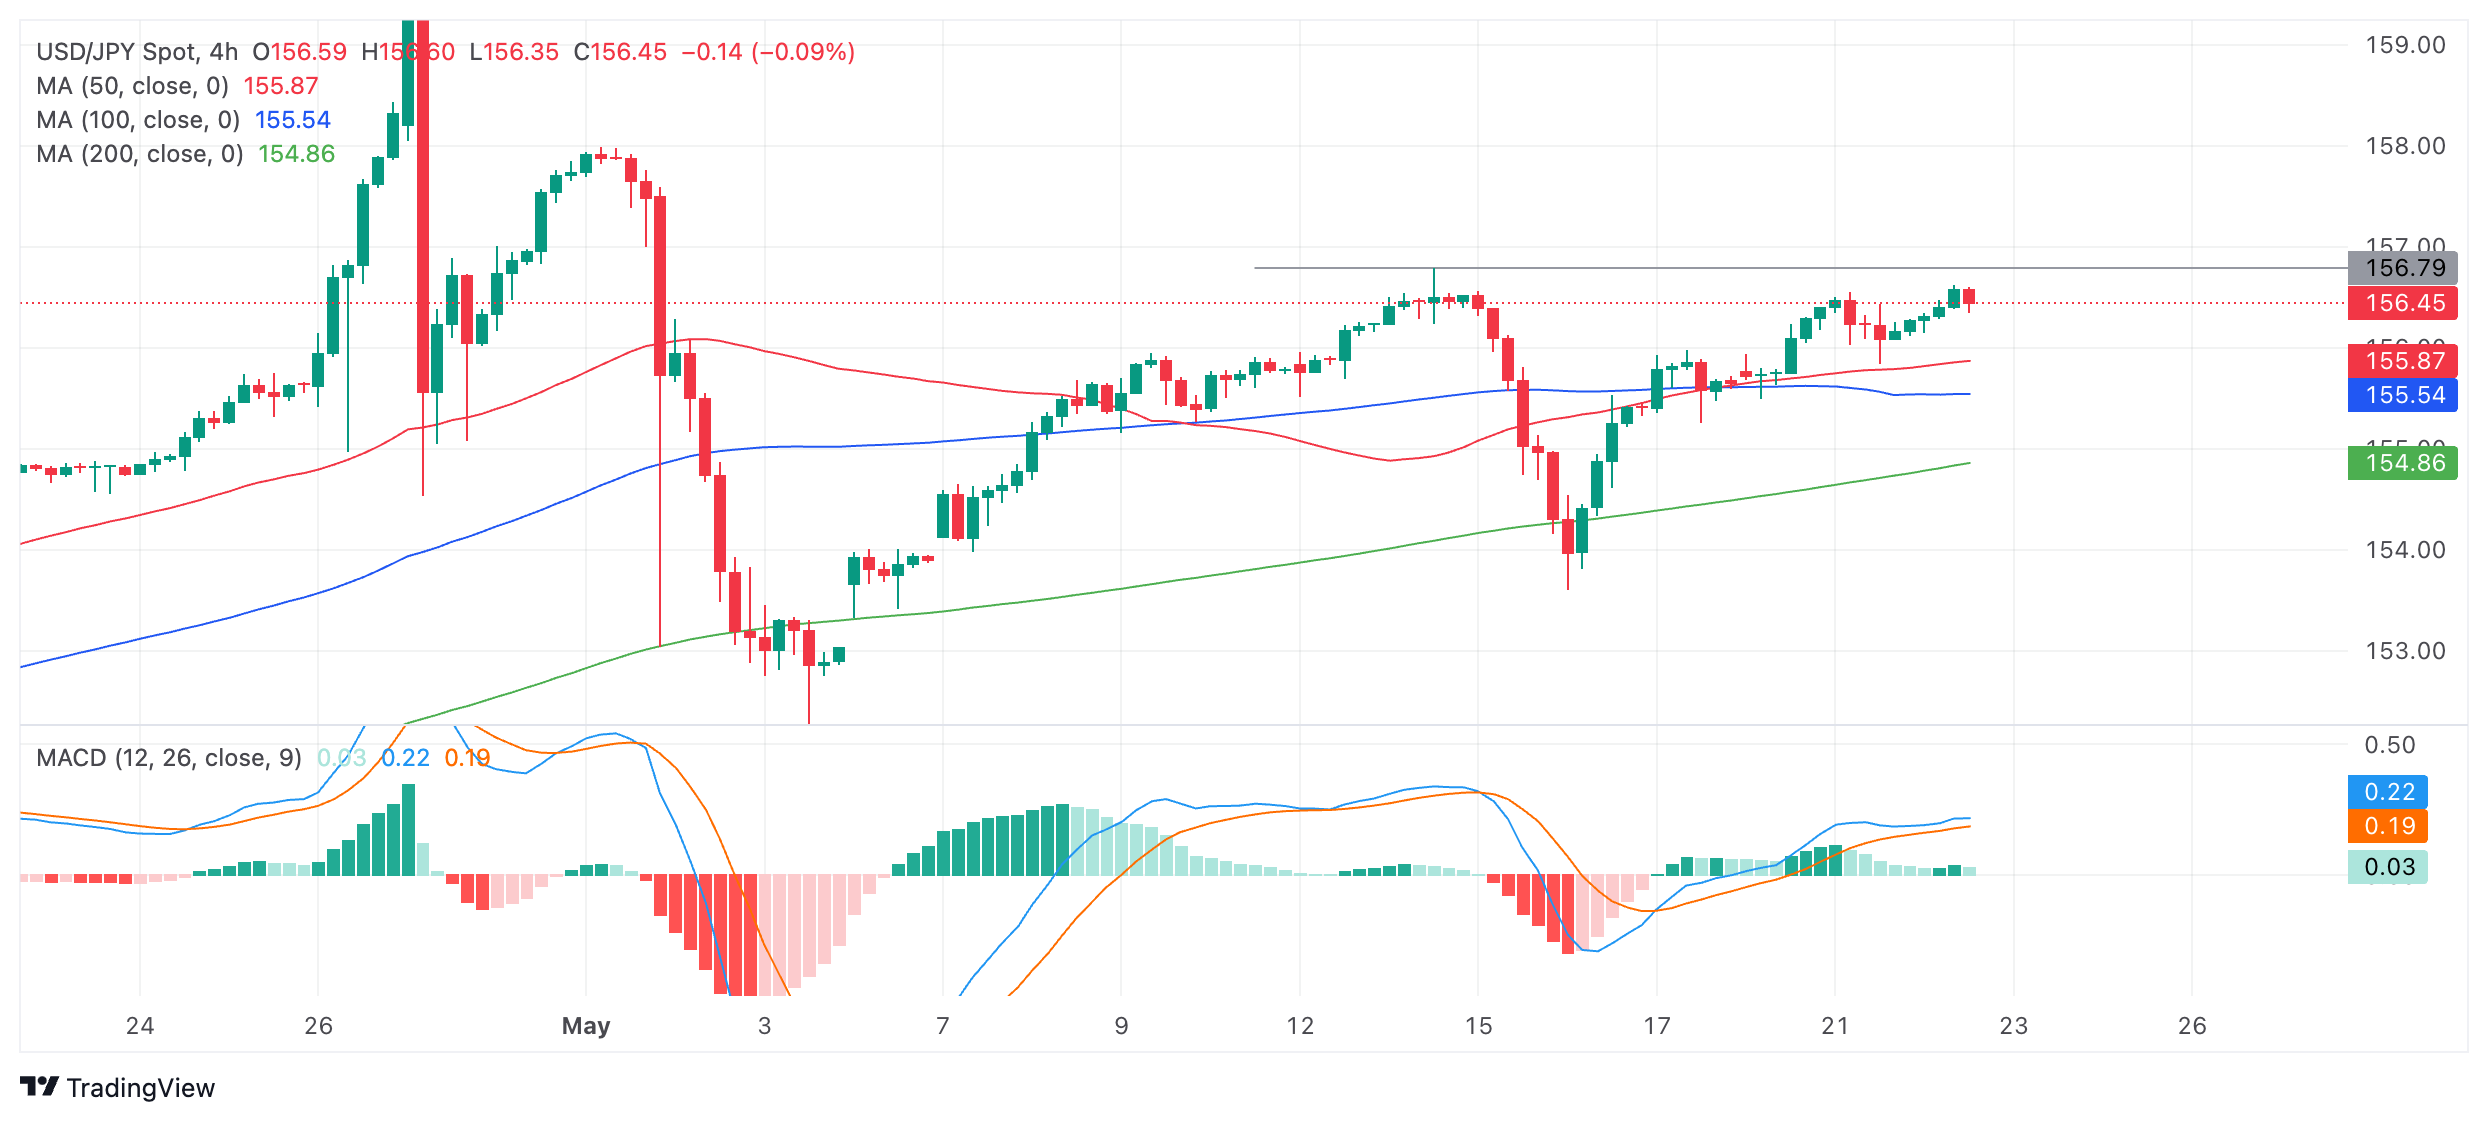
USD/JPY has rallied up to retest technical resistance at around 156.79 (May 14 high), and there is a possibility it could temporarily falter.
USD/JPY Daily Chart

USD/JPY is in an uptrend on all timeframes, however, and given “the trend is your friend” this favors more upside eventually even if there is a correction at the aforementioned resistance level.
The Moving Average Convergence Divergence (MACD) momentum indicator is showing a lack of momentum in the most recent move up from the May 16 lows, which could be a warning sign. The blue MACD line has not crossed below the red signal line, however, as would be expected to accompany the beginning of a deeper pullback.
If USD/JPY corrects it will probably find support at the level of the cluster of Moving Averages between 155.50-80.
A break above the resistance level at 156.79 on a 4-hour period closing basis would indicate a continuation of the uptrend, with the next upside target probably at the 157.98 May 1 high.
