GBP/USD catches a much-needed break, grasping at 1.22
- The GBP/USD caught some lift on Thursday, rising back to the 1.2200 handle.
- Friday sees UK GDP figures amidst a slew of low-tier data.
- The Pound Sterling is broadly expected to continue weakening looking out long-term.
The GBP/USD managed to eke out a minor recovery on Friday, owing more to a step back in the broad-market US Dollar Index (DXY) than any intrinsic strength to be found in the Pound Sterling (GBP).
Market analysts broadly expect the GBP to continue to weaken moving forward, and a continued backslide to the 1.2000 major handle is all but a foregone conclusion for many instutitions.
The upcoming Friday trading session will kick things off for the GBP/USD with UK Gross Domestic Product figures due at 06:00 GMT. The UK GDP for the second quarter is forecast to hold steady at 0.2%, and a miss for headline economic growth in the British economy is all set to see the Pound lose what little gains it's recovered for Thursday.
Friday also brings high-impact data for the USD, most notably the Personal Consumption Expenditure (PCE) Price Index at 12:30 GMT. The PCE numbers are expected to hold steady at 0.2% for the month of August, with the annualized figure for the same period seen ticking down from 4.2% to 3.9%.
US figures hit a middling note on Thursday, with US Initial Jobless Claims clocking in at 204K versus the previous 202K; US annualized GDP for the second quarter came in exactly at expectations at 2.1%.
The big miss for Thursday was US Pending Home Sales, which surprised to the downside by not-insignificant -7.1%, far below the forecast -0.8% and dropping away from the previous 0.9%.
Read More:
GBP/USD remains vulnerable to the 1.20/1.21 area – ING
The Pound and Euro should weaken substantially through early 2024 – Wells Fargo
GBP/USD needs to surpass 1.2350 to show more meaningful technical strength – Scotiabank
GBP/USD technical outlook
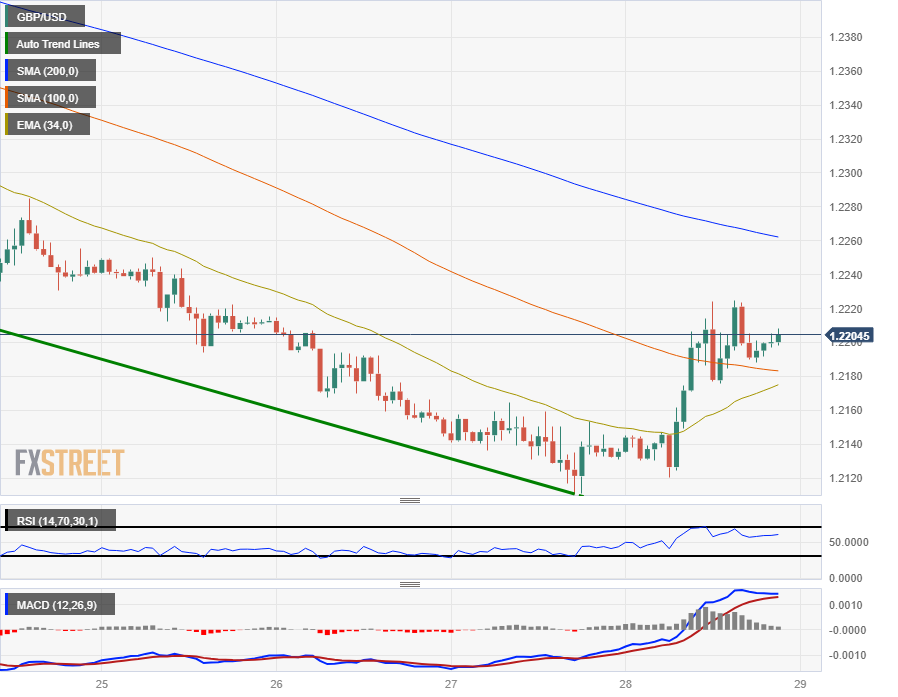
The GBP/USD rose half a percent on Thursday, lifting to a session high of 1.2220 after pinging into six-month lows at 1.2110 the previous day.
Hourly candles have the pair rising into technical support coming down from the bearish 200-hour Simple Moving Average (SMA) near 1.2260.
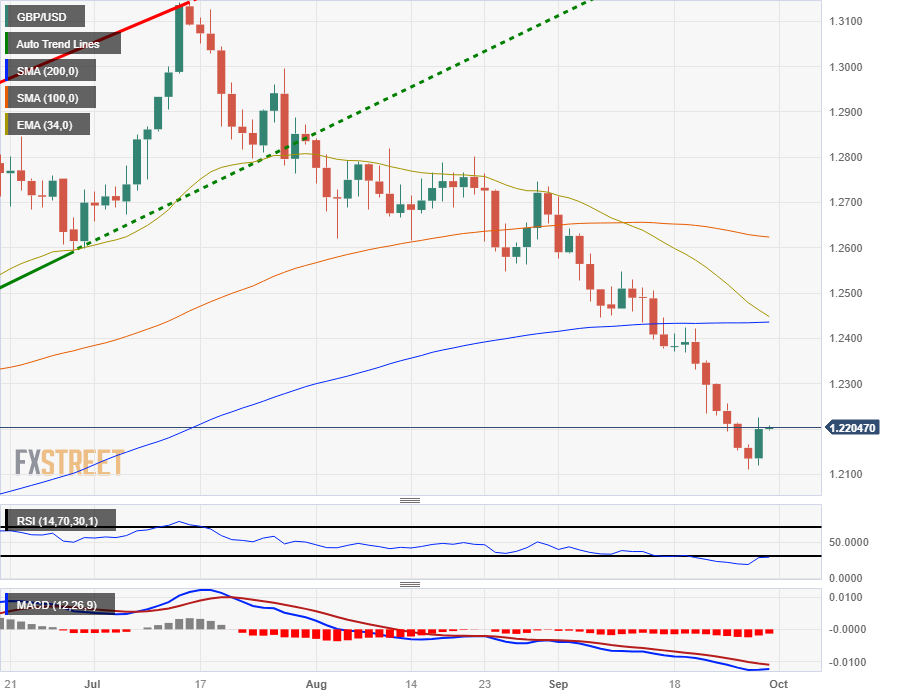
On daily candlesticks the GBP/USD is firmly bearish and potentially primed for a minor relief rally. Price action will be capped off by the 200-day SMA above 1.2400, and the 34-day Exponential Moving Average (EMA) is racing to make a bearish cross of the longer moving average.
the GBP/USD is over 7% off its last meaningful swing high in July at 1.3140.
GBP/USD hourly chart
GBP/USD daily chart
GBP/USD technical levels