Gold Price Forecast: XAU/USD rebounds firmly to near $1,930 despite US Durables remains upbeat
- Gold price has shown a confident recovery from $1,930.00 despite US Durables having outperformed consensus.
- US Census Bureau has reported that Durable data have expanded by 1.7% while the street was anticipating a contraction of 1%.
- The US Dollar Index has extended its downside to near 102.40 despite fears of more interest rate hikes from the Fed.
Gold price (XAU/USD) has displayed a recovery move from $1,920.00 in the early New York session. The precious metal has attracted significant bets despite the United States Durable Goods Orders data (May) having landed better than expectations.
US Census Bureau has reported that Durable Goods Orders have expanded by 1.7% while the street was anticipating a contraction of 1%. May’s Durables data has outperformed April’s figure of 1.2%. Durables data excluding defense orders have expanded by 3.0% against expectations of a stagnant performance. This indicates that demand for consumer durables was resilient and conveys that core inflation could turn out persistent further.
Upbeat US Durables data has propelled chances of one more interest rate hike by the Federal Reserve (Fed) for its July meeting. As per the CME Fedwatch tool, around 77% chances are in favor of a 25 basis point (bp) interest rate hike from the Fed for the July meeting.
Meanwhile, S&P500 futures have surrendered half of their gains amid a cautious market mood. The upcoming quarterly result season has kept investors on their toes.
The US Dollar Index (DXY) has extended its downside to near 102.40 despite fears of more interest rate hikes from the Fed. Fed chair Jerome Powell has confirmed that the central bank will continue tightening monetary policy but at a ‘careful pace’.
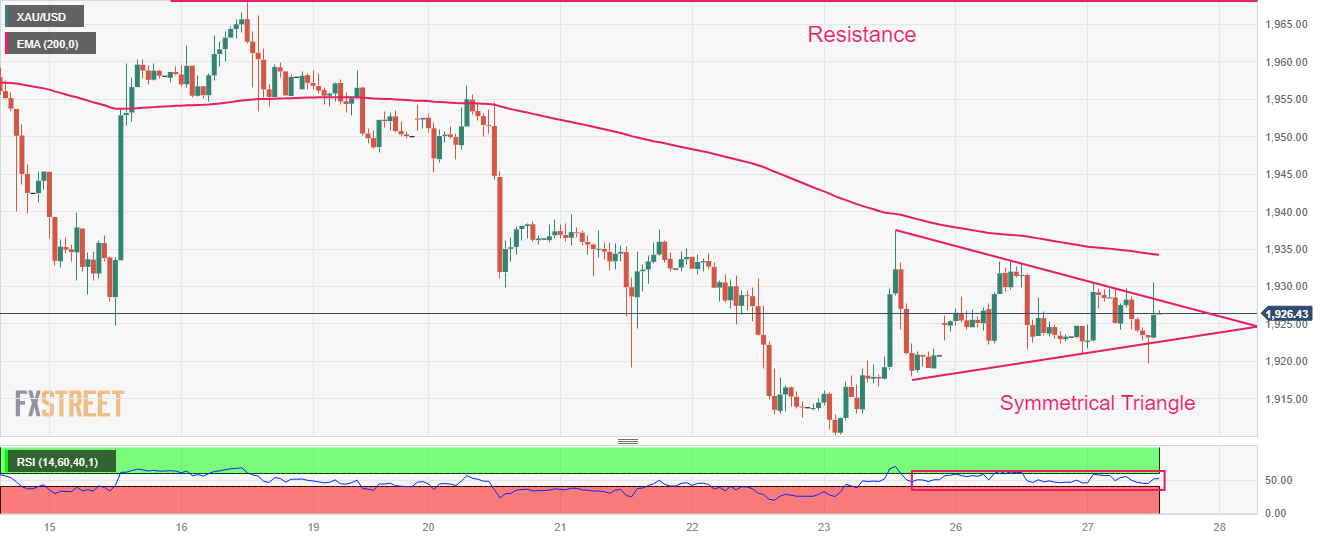
Gold technical analysis
Gold price is attempting an upside break of the Symmetrical Triangle chart pattern formed on an hourly scale. An upside break will trigger an explosion in the volatility contraction, which will result in wider ticks and heavy volume.
The precious metal is trading below the 200-period Exponential Moving Average (EMA) at $1,934.50, which indicates that the long-term trend is bearish.
Meanwhile, the Relative Strength Index (RSI) (14) is oscillating in the 40.00-60.00 range, portraying a lackluster performance.
Gold hourly chart