Gold Price Forecast: XAU/USD recovers from below $1,960, still remains choppy despite sell-off in USD Index
- Gold price has recovered from a minor fall to near $1,956.00 but has turned choppy again.
- The Fed is more likely to leave rates unchanged, rather than cut them any time soon.
- Gold price is showing signs of sheer volatility contraction as the US economic calendar has nothing much to offer.
Gold price (XAU/USD) has returned inside the woods after an attempt at a downside break in the late European session. The precious metal recovered after dropping to near $1,956.00 but has turned choppy again amid an absence of potential triggers.
The recovery move in the Gold price was supported by the vertical sell-off in the US Dollar Index (DXY). The USD Index has slipped below 103.90 as expectations for a raise in interest rates by the Federal Reserve (Fed) have receded. While monetary policies of other central banks belonging to the G7 cartel are far from any sort of a pause amid persistence in inflation in their respective countries.
Analysts at Rabobank cited that given the Fed is more likely to leave rates unchanged, rather than cut them any time soon, the U.S. dollar is likely to boast a natural edge over other currencies for now.
Meanwhile, S&P500 futures have recovered their losses and have turned positive amid rising hopes that Fed chair Jerome Powell will keep interest rates steady. Also, Fed Powell cited last that more interest rate hikes are less appropriate as tight credit conditions are doing the job effectively. The risk appetite of the market participants has improved, which has increased the appeal for risk-perceived assets.
Gold technical analysis
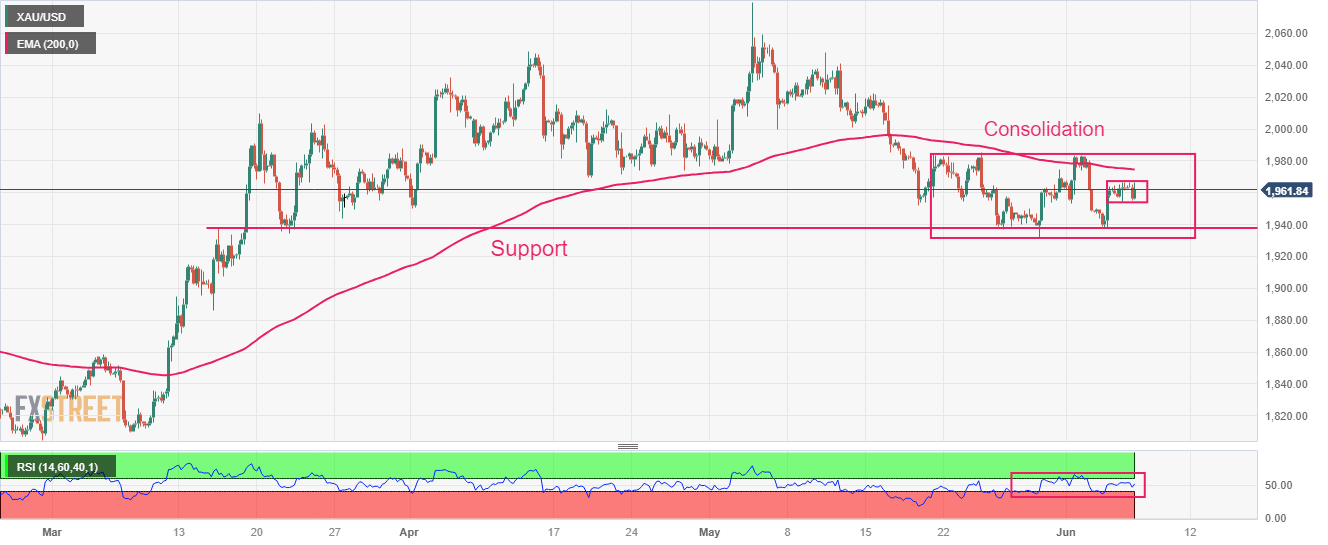
Gold price is showing signs of sheer volatility contraction as the US economic calendar has nothing much to offer. Investors should note that a squeeze in volatility is followed by an expansion in the same, which results in wider ticks and heavy volume.
On a broader note, Gold price is consolidating in a range of $1,932-1,985 for the past three weeks on a four-hour. Horizontal support is plotted from March 15 high at $1,937.39. The magical 200-period Exponential Moving Average (EMA) at $1,975.47 is acting as a strong barrier for the Gold bulls.
An oscillation in the 40.00-60.00 territory by the Relative Strength Index (RSI) (14) indicates a non-directional performance.
Gold four-hour chart

