GBP/USD Price Analysis: Bulls stay in control and eye a test of trendline resistance
- GBP/USD bears on the lookout for a break of head and shoulders neckline support.
- Bulls eye a move to test trendline resistance.
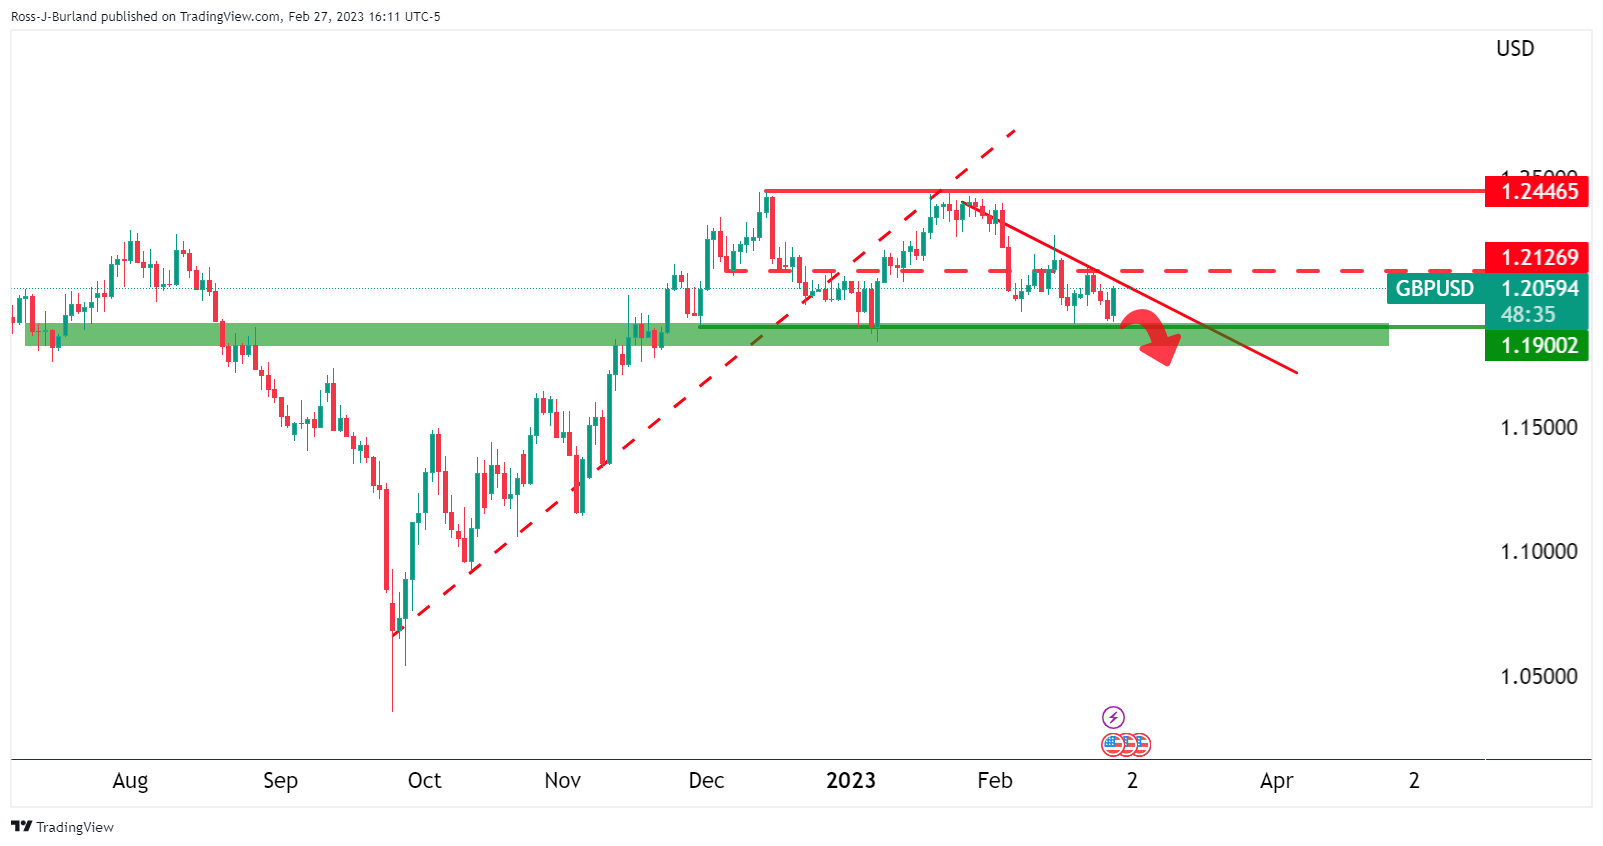
GBP/USD could be on the verge of a move higher but a retest of the prior resistance could also be in order. The bears are seeking a break of a key daily support structure while the bulls are relying on a move to test trendline resistance.
GBP/USD daily chart

On a break of daily support, 1.1900, the bias will be on the downside with the price below trendline resistance. This would mark a bearish head and shoulders with the price below the neckline.
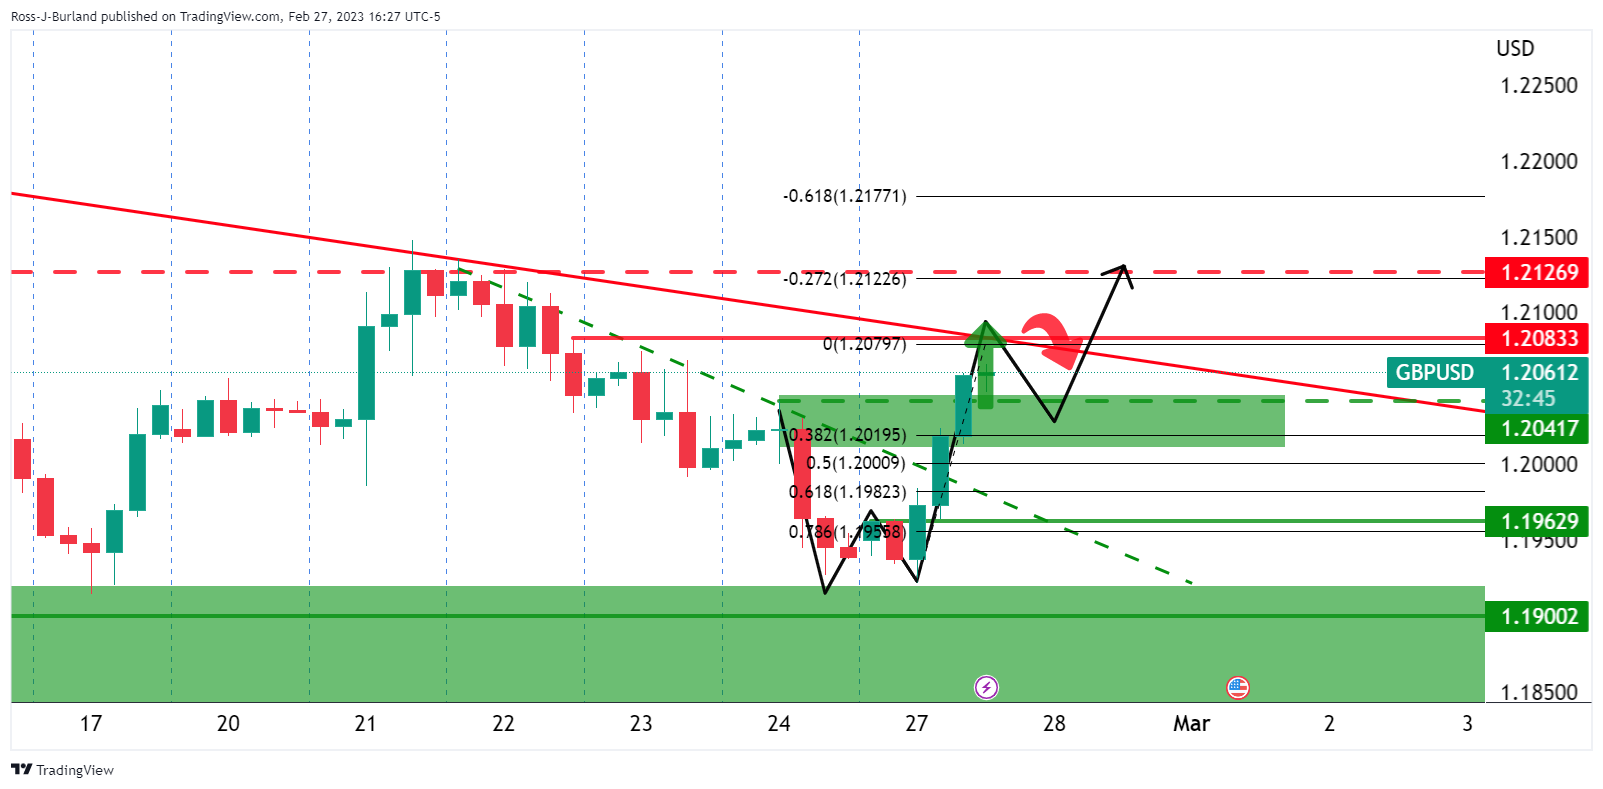
GBP/USD H1 chart

However, in the meantime, there is a bias to the upside with the 1.2080s in reach. This will take the pair up to test the trendline resistance but the W-formation is also compelling. A retest of the prior resistance could see the bulls emerge again and equate to an area of support between 1.2050 and 1.2000. Lower down the Fibonacci scale, the 78.6% aligns with the neckline of the formation near 1.1960.
