Silver Price Analysis: XAG/USD pares the first daily gains in six near $21.00
- Silver price fades bounce off 100-SMA, retreats from three-day-old resistance line.
- Bearish RSI divergence keeps sellers hopeful to aim for 200-SMA.
- Monthly support line adds to the downside filters, buyers need validation from $21.30.
Silver price (XAG/USD) retreats from intraday high as sellers approach $21.00 during early Tuesday morning in Europe.
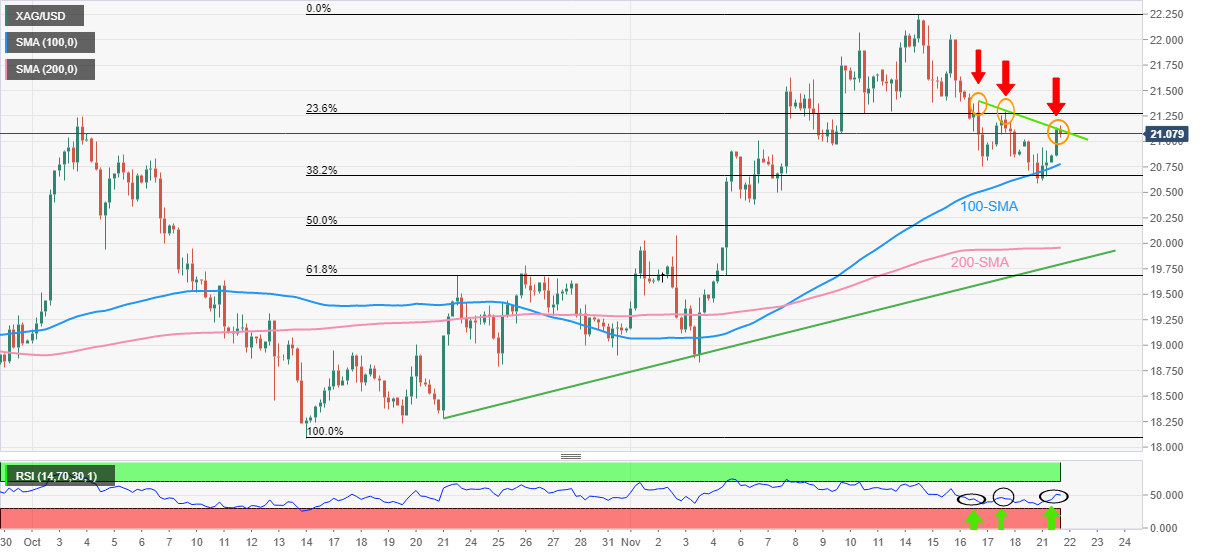
In doing so, the bright metal eases from a downward sloping trend line from Thursday while consolidating the first daily gains in six.
It’s worth noting that the lower high formation in the last three days join higher-high on the Relative Strength Index (RSI) placed at 14, which in turn portrays a hidden bearish divergence and suggests further downside of the metal.
That said, the 100-SMA level surrounding $20.80 acts as an immediate support ahead of directing the XAG/USD bears towards the $20.00 psychological magnet.
In a case where silver sellers keep the reins past $20.00, the 200-SMA and one-month-old ascending trend line, respectively near $19.95 and $19.80, could challenge the bearish bias for the metal.
Alternatively, sustained trading beyond the aforementioned resistance line, close to $21.15 at the latest, could tease the XAG/USD buyers.
Even so, October’s peak and 23.6% Fibonacci retracement level of the metal’s upside between October and November, near $21.30, could challenge the silver bulls before directing them to the monthly high of $22.25.
Silver: Four-hour chart
Trend: Further weakness expected