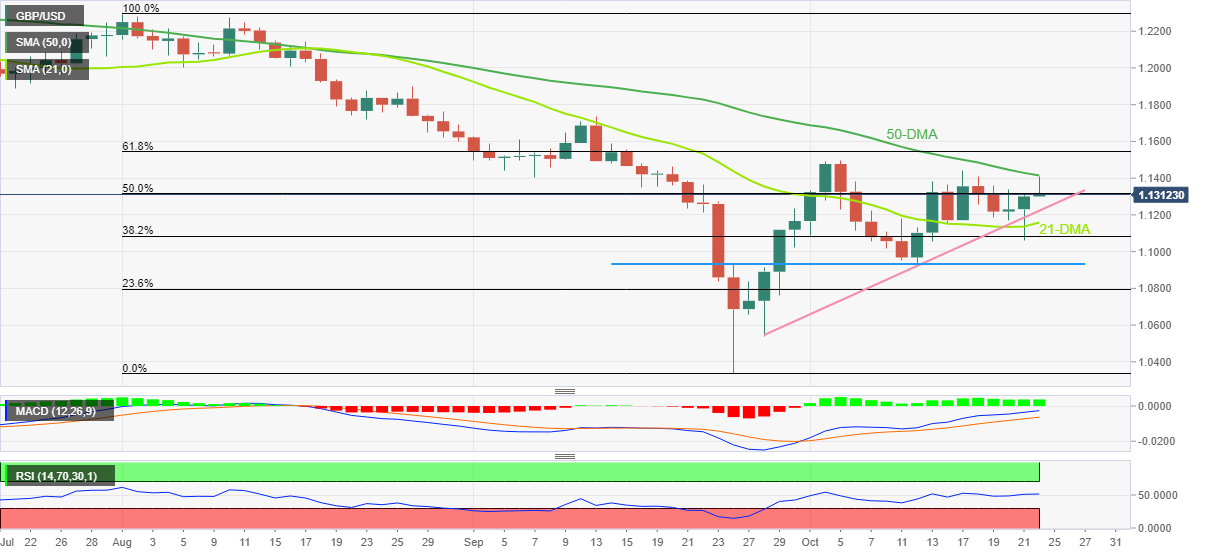
GBP/USD Price Analysis: Keeps pullback from 50-DMA near 1.1300
- GBP/USD reverses from one-week high as sellers approach 21-DMA, monthly support line.
- Bullish MACD signals, firmer RSI (14) keeps buyers hopeful.
- One-month-old horizontal support adds to the downside filters.
GBP/USD stays defensive around a one-month-long support line, after reversing from the highest levels in a week, to 1.1300 during early Monday morning in Europe.
In doing so, the Cable pair reverses from the 50-DMA while declining back towards an upward-sloping support line from September 28.
Given the bullish MACD signals and the steady RSI, the GBP/USD prices are likely to remain firmer unless breaking the aforementioned immediate support line surrounding 1.1230.
Even if the quote drops below 1.1260 support, the 21-DMA level near 1.1155 and the one-month-old horizontal support near 1.0935 could challenge the GBP/USD bears.
It should be noted that a clear downside break of 1.0935 won’t hesitate to challenge the record low of 1.0339. However, the 1.0650 and 1.0540 levels may offer intermediate halts during the fall.
Alternatively, a clear upside break of the 50-DMA hurdle surrounding 1.1415 could push the GBP/USD buyers toward the monthly high near 1.1490.
Following that, the 61.8% Fibonacci retracement level of the pair’s August-September declines and September’s peak, close to 1.1545 and 1.1740 in that order, will act as extra barriers to the north for the GBP/USD pair buyers to watch.
GBP/USD: Daily chart

Trend: Recovery expected
